Out of the 7,768 records identified through database searching and other sources, 88 full-text articles were assessed for eligibility and 33 studies met our eligibility criteria12,13,14,15,16,17,18,19,20,21,22,23,36,37,38,39,40,41,42,43,44,45,46,47,48,49,50,51,52,53,54,55,56 (see Supplementary Fig. S1 online). The entire list of the 55 full-text articles excluded, with reasons can be found as Supplementary Table S3 online. Among the studies that met our eligibility criteria, three studies46,49,54 were subsequently excluded due to duplicate publications (Nurses’ Health Study12,54, Caerphilly13,49, Health Professionals Follow-up Study46,55). In three other studies, there was overlap between the study populations (Malmö Diet and Cancer cohort (one of the Swedish contributions to the European Prospective Investigation Into Cancer and Nutrition (EPIC) cohort)16, EPIC-NL cohort (the Dutch contribution to the EPIC cohort)52, EPIC21) and the exposures considered. The three studies were retained but only the results on the common exposures (milk, yogurt, cheese) from the EPIC cohort21 were included in the data synthesis. From the Malmö Diet and Cancer cohort16, the results on total dairy and butter were included in the data synthesis, and from the EPIC-NL cohort52, the results on total dairy, low-fat dairy and high-fat dairy were included in the data synthesis due to the different exposures than in the EPIC cohort21. Thus, 30 studies were included in the qualitative data synthesis12,13,14,15,16,17,18,19,20,21,22,23,36,37,38,39,40,41,42,43,44,45,47,48,50,51,52,53,55,56 (20 studies for CHD12,13,16,17,18,19,20,21,22,37,38,39,40,45,48,50,51,52,53,56 and 12 for ischemic stroke13,14,15,23,36,40,41,42,43,44,47,55). Included in the meta-analysis were 18 studies12,13,14,15,16,17,18,19,20,21,22,37,38,40,42,43,44,45 (13 studies for CHD12,13,16,17,18,19,20,21,22,3738,40,45 and 7 for ischemic stroke13,14,15,40,42,43,44). No studies on peripheral artery disease were identified.
Table 1 shows the characteristics of the 20 studies on CHD12,13,16,17,18,19,20,21,22,37,38,39,40,45,48,50,51,52,53,56. Among the 20 studies, 5 presented gender-specific results17,20,21,50,53, 3 comprised only men13,45,56 and 3 comprised only women12,18,40. A single study was from Asia22, 13 from Europe13,16,18,19,20,21,37,38,39,45,50,52,53 and 5 from North America12,17,40,48,56. A single study comprised 21 countries in 5 continents51. The age at entry ranged from 38 to 72 years and the length of follow-up time from 5 to 22 years. All studies except for two of them22,51 were classified as being at low risk of bias (see Supplementary Table S4 online).
Table 2 shows the characteristics of the 12 studies on ischemic stroke13,14,15, 23, 36, 40,41,42,43,44, 47, 55. Among the 12 studies, 1 study presented gender-specific results55, 3 comprised only men13, 15, 23 and 3 comprised only women14, 36, 40. One study was from Asia41, five from Europe13, 15, 42,43,44 and six from North America14, 23, 36, 40, 47, 55. The age at entry ranged from 46 to 65 years and the length of follow-up time from 8 to 23 years. All studies except for three of them23, 41, 43 were classified as being at low risk of bias (see Supplementary Table S4 online).
Supplementary Table S5 online shows the definition of dairy products as described in the studies, and Supplementary Table S6 online comprises an overview of which of the studies contributed to each of the meta-analyses. Supplementary Table S7 online shows the funding sources of the studies.
Total dairy
Overall, the studies indicated no association between total intake of dairy, intake of low-fat dairy or intake of high-fat dairy and risk of CHD or ischemic stroke (see Supplementary Fig. S2–S4 online).
Milk
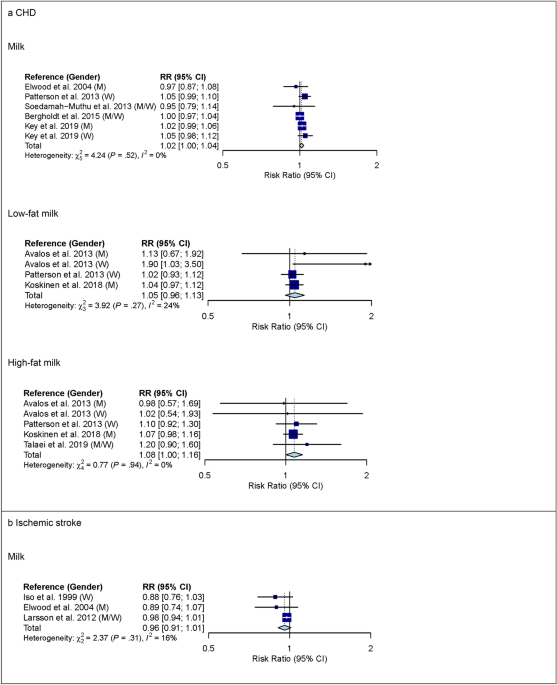
For milk, 6 studies with 619,460 participants and 16,478 cases were included in the high versus low intake meta-analysis for CHD (overall intake range: 0–710 g/d). Comparing the highest with the lowest category of milk intake, no association was observed for CHD (RR 1.02 (95% CI 0.92–1.13); I2 = 67%; Pheterogenity (Phet) < 0.01) (see Supplementary Fig. S5 online). Comparing the highest with the lowest category of low-fat milk intake, no association with CHD was observed (RR 1.05 (95% CI 0.92–1.20); I2 = 59%; Phet = 0.03; n studies = 5), whereas comparing the highest with the lowest category of high-fat milk intake, a higher risk of CHD was observed (RR 1.16 (95% CI 1.01–1.33); I2 = 53%; Phet = 0.04; n studies = 6) (see Supplementary Fig. S5 online). The observed heterogeneity between studies was not explained by pre-specified subgroup analyses (see Supplementary Table S8 online). In linear dose–response meta-analysis, no associations were observed between milk intake or low-fat milk intake and CHD (Fig. 1). However, each additional daily 200 g of high-fat milk was associated with an 8% higher risk of CHD (RR 1.08 (95% CI 1.00–1.16); I2 = 0%; Phet = 0.94; n studies = 4) (Fig. 1). Supplementary Table S9 online shows subgroup dose–response meta-analysis by study characteristics. No evidence of non-linear dose–response associations was observed (data not shown).

Linear dose–response meta-analysis. Summary RR of CHD (panel a) and ischemic stroke (panel b) per 200 g higher intake of milk/day. P = 0.12 for the association between milk and CHD. P = 0.04 for the association between high-fat milk and CHD. CHD coronary heart disease; CI confidence interval; M males; RR risk ratio; W women.
Three studies with 163,128 participants and 3,691 cases were included in the high versus low intake meta-analysis for milk and ischemic stroke (overall intake range: 0–710 g/day). Comparing the highest with the lowest category of milk intake, a lower risk of ischemic stroke was observed (RR 0.88 (95% CI 0.79–0.98); I2 = 0%; Phet = 0.52) (see Supplementary Fig. S5 online). In linear dose–response meta-analysis, no association between milk intake and ischemic stroke was observed (Fig. 1). Supplementary Tables S8 and S9 online show subgroup meta-analysis by study characteristics. No evidence of a non-linear dose–response association was observed (data not shown).
Yogurt
For yogurt, 6 studies with 552,342 participants and 14,226 cases were included in the high versus low intake meta-analysis for CHD (overall intake range: 0–440 g/day). Comparing the highest with the lowest category of yogurt intake, no association with CHD was observed (RR 0.99 (95% CI 0.91–1.08); I2 = 49%; Phet = 0.06) (see Supplementary Fig. S6 online). In pre-specified subgroup analysis by continent, however, heterogeneity between continents was observed (P < 0.05) but no association between yogurt and CHD was observed in studies from Europe (RR 0.96 (95% CI 0.89–1.04); I2 = 42%; Phet = 0.12; n studies = 5) or in studies from North America (RR 1.25 (95% CI 0.97–1.61); I2 = 0%; Phet = 0.71; n studies = 1) (see Supplementary Table S10 online). No association between low-fat or high-fat yogurt and CHD was observed (see Supplementary Fig. S6 online). In linear dose–response meta-analysis, no association between yogurt and CHD was observed (RR 0.98 (95% CI 0.93–1.03) per 100 g higher intake per day; I2 = 42%; Phet = 0.11; n studies = 5) (Fig. 2). However, heterogeneity between continents was observed (P < 0.05) but no association between yogurt and CHD was observed in studies from Europe (RR 0.97 (95% CI 0.93–1.01) per 100 g higher intake per day; I2 = 35%; Phet = 0.19; n studies = 4) or in studies from North America (1.20 (95% CI 0.98–1.48) per 100 g higher intake per day; I2 = 0%; Phet = 0.71; n studies = 1) (see Supplementary Table S11 online). No evidence of a non-linear dose–response association was observed (data not shown).

Linear dose–response meta-analysis. Summary RR of CHD (panel a) and ischemic stroke (panel b) per 100 g higher intake of yogurt/day. Yogurt defined as yogurt/other soured milk products. CHD coronary heart disease; CI confidence interval; M males; RR risk ratio; W women.
Three studies with 187,281 participants and 6,208 cases were included in the high versus low intake meta-analysis for yogurt and ischemic stroke (overall intake range: 0–400 g/day). Comparing the highest with the lowest category of yogurt intake, no association for ischemic stroke was observed (see Supplementary Fig. S6 online). Supplementary Table S10 online shows subgroup high versus low intake meta-analysis by study characteristics. Also in linear dose–response meta-analysis, no association between yogurt intake and ischemic stroke was observed (Fig. 2).
Cheese
For cheese, 7 studies with 554,323 participants and 14,698 cases were included in the high versus low intake meta-analysis for CHD (overall intake range: 0–120 g/day). Comparing the highest with the lowest category of cheese intake, a lower risk of CHD was observed (RR 0.91 (95% CI 0.84–0.99); I2 = 37%; Phet = 0.12) (see Supplementary Fig. S7 online). In pre-specified subgroup analysis by gender, however, heterogeneity between genders was observed (P = 0.03) (see Supplementary Table S12 online). In studies among men, comparing the highest with the lowest category of cheese intake, no association with CHD was observed (RR 1.03 (95% CI 0.93–1.13); I2 = 0%; Phet = 0.74; n studies = 3). In studies among women, comparing the highest with the lowest category of cheese intake, a lower risk of CHD was observed (RR 0.82 (95% CI 0.69–0.97); I2 = 33%; Phet = 0.23; n studies = 3). No association between low-fat or high-fat cheese intake and CHD was observed but heterogeneity for low-fat cheese intake was observed (see Supplementary Fig. S7 online). The observed heterogeneity between studies was not explained by subgroup analyses (see Supplementary Table S12 online). In linear dose–response meta-analysis, each additional daily 20 g of cheese was associated with a 4% lower risk of CHD (RR 0.96 (95% CI 0.93–0.98); I2 = 3%; Phet = 0.41; n studies = 6) (Fig. 3) and no heterogeneity between genders was observed (P = 0.55) (see Supplementary Table S13 online). In studies among men, the summary RR estimate for cheese intake of 20 g/day was 0.96 (95% CI 0.92–1.00) and in studies among women, the summary RR estimate for cheese intake of 20 g/day was 0.94 (95% CI 0.90–0.98). No association between low-fat cheese intake and CHD was observed but heterogeneity was observed (Fig. 3). The observed heterogeneity between studies was not explained by subgroup analyses (see Supplementary Table S13 online). No evidence of a non-linear dose–response association was observed (data not shown).

Linear dose–response meta-analysis. Summary RR of CHD (panel a) and ischemic stroke (panel b) per 20 g higher intake of cheese/day. P < 0.05 for heterogeneity for the association between cheese and ischemic stroke. CHD coronary heart disease; CI confidence interval; M males; RR risk ratio; W women.
Three studies with 187,281 participants and 6,208 cases were included in the high versus low intake meta-analysis for cheese and ischemic stroke (overall intake range: 0–400 g/day). Comparing the highest with the lowest category of cheese intake, no association with ischemic stroke was observed (see Supplementary Fig. S7 online). Supplementary Table S12 online shows subgroup high versus low intake meta-analysis by study characteristics. Also in linear dose–response meta-analysis, no association between cheese intake and ischemic stroke was observed but heterogeneity was observed (Fig. 3). The observed heterogeneity between studies was not explained by subgroup analyses (see Supplementary Table S13 online). No evidence of a non-linear dose–response association was observed (data not shown).
Butter
For butter, 4 studies with 128,757 participants and 6,562 cases were included in the high versus low intake meta-analysis for CHD (overall intake range: 0–63 g/day). Comparing the highest with the lowest category of butter intake, no association was observed for CHD (see Supplementary Fig. S8 online). Also in linear dose–response meta-analysis, no association between butter intake and CHD was observed (Fig. 4). Supplementary Tables S14 and S15 online show subgroup meta-analysis by study characteristics.

Linear dose–response meta-analysis. Summary RR of CHD (panel a) and ischemic stroke (panel b) per 6 g higher intake of butter/day. CHD coronary heart disease; CI confidence interval; M males; RR risk ratio; W women.
In linear dose–response meta-analysis, no association between butter intake and ischemic stroke was observed (Fig. 4).
Substitutions between dairy product subgroups
In linear dose–response meta-analysis, no associations between substitutions among dairy product subgroups (low-fat milk, high-fat milk, low-fat yogurt, high-fat yogurt, cheese and butter) and risk of ischemic stroke were observed (Fig. 5).


Linear dose–response meta-analysis. Summary RR of ischemic stroke for substitutions between dairy product subgroups (per 1 serving/day). For example in the mean of substitution of low-fat milk for high-fat milk; i.e. low-fat milk takes the place of high-fat milk). For milk and yogurt, the serving size was 200 g, for cheese 20 g, and for butter 6 g. Yogurt defined as yogurt/other soured milk products. CI confidence interval; M males; RR risk ratio; W women.
Sensitivity analyses
One study22, investigating high-fat milk intake and risk of CHD, was excluded in low risk of bias sensitivity analysis. The reanalyses produced small changes in the summary RR estimates and corresponding 95% CIs (see Supplementary Fig. S9 online). Using a fixed-effects model to calculate summary RR estimates and corresponding 95% CIs produced narrower CIs, and eight of the summary RR estimates became statistically significant (see Supplementary Table S16 online). Among these analyses, heterogeneity was observed in four analyses; thus, the narrower CIs from the fixed-effects model were not considered reliable. In four other analyses, no heterogeneity was observed. In these analyses, except for one, the fixed-effects model produced borderline statistical significance with CIs including 0.99. The exception was the linear dose–response meta-analysis of substitution of low-fat yogurt for high-fat yogurt where the fixed-effects model produced statistical significance with a CI of 1.03–1.50 while Cochran’s Q-test for heterogeneity was borderline statistically significant with P = 0.08 (I2 = 67%). In that case, we deem the analysis inconclusive. There was no evidence of publication bias with the exception of high versus low intake meta-analysis of yogurt and risk of CHD (Egger’s test: P < 0.01). Visual inspection of funnel plots suggested moderate small study effects towards the null for yogurt intake and risk of CHD in both high versus low intake and dose–response meta-analysis (see Supplementary Fig. S10 online).
Quality of meta-evidence
Table 3 provides an overview of the findings from linear dose–response meta-analysis on dairy product subgroups and risk of CHD, and NutriGrade meta-evidence grading. The grading was rated moderate for high-fat milk and cheese, and low for milk, low-fat milk, yogurt, low-fat cheese and butter.
Table 4 provides an overview of the findings from linear dose–response meta-analysis on dairy product subgroups and risk of ischemic stroke, and NutriGrade meta-evidence grading. The grading was rated low for milk, yogurt, cheese and butter, and very low for all substitutions between dairy product subgroups.