Subjects
We performed the experiment at the International Center for the Assessment of Nutritional Status (ICANS), University of Milan (Italy), between March and June 2018. Thirty-six (18 women and 18 men) healthy young adults, were recruited on a voluntary basis among students of the University of Milan. Participants were non-smoking men and women, aged 18–35 years, normal weight, and apparently healthy. Subjects were excluded if they were overweight or obese, reported a medical diagnosis of any disease-causing significant impairment of nutritional status (i.e., Crohn’s disease, malignancy, end-stage renal failure, cirrhosis, congestive heart failure, and chronic infection) or endocrine disease (ie, hyper- and hypo-thyroidism and diabetes mellitus), used medications affecting endocrine function in the previous 2 months, had an acute illness or injury in the previous month, or were elite athletes. The use of oral contraceptives was another reason for exclusion from the study. Finally, in order to reduce the effect of sex hormones on glucose metabolism, all women participated in the study during the follicular phase of the menstrual cycle. This study was conducted according to the guidelines laid down in the Declaration of Helsinki. The study was approved by the ethics committee of the University of Milan (protocol n. 32/17). Written informed consent was obtained from all participants.
Sample selection
Sample size calculation was based on glucose areas under the curves of men and women obtained in a previous study after administration of a mixed meal [14]. With 80% power and a 5% significance level, it was estimated that a sample of 34 volunteers (17 women and 17 men) was sufficient to detect a high effect (Cohen’s d = 0.98) in postprandial glucose responses among the sexes.
Experimental protocol
In the days before the start of the experiment, subjects were invited to our laboratory where a physician performed a detailed medical and clinical examination. Medical history and any drug therapy were recorded. Anthropometric measurements were taken, and abdominal subcutaneous (SAT) and visceral adipose tissue (VAT) thicknesses were measured by ultrasound. A blood sample was also taken in order to exclude subjects with impaired fasting blood glucose (serum glucose ≥ 100 mg/dl) and insulin resistance (HOMA index > 2.5). Subjects were asked to complete the IPAQ questionnaire to assess their level of physical activity [21]. Finally, women were asked to report the first day of their last menstrual period.
We asked subjects to consume, the evening before the experiment, a standardized dinner consisting of pasta or rice seasoned with olive oil and/or parmesan cheese and/or tomato sauce, meat or fish, vegetables seasoned with olive oil, bread, and fresh fruit. In addition, we asked subjects to drink only water.
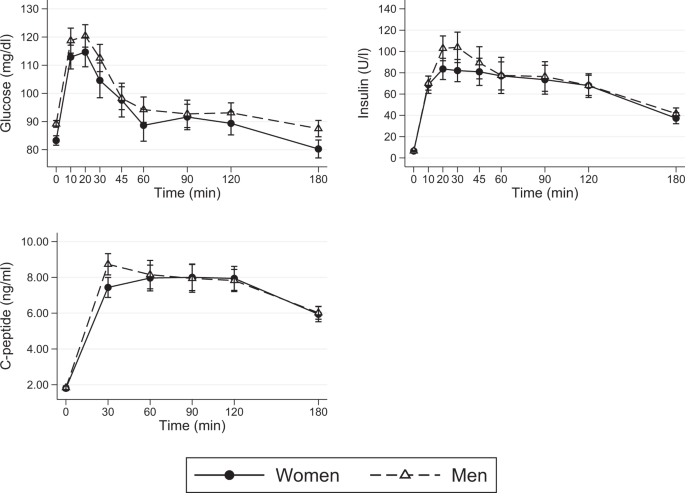
On the day of testing, subjects arrived at ICANS at 8:30 am fasting. After settling into the room set up for testing, an intravenous catheter was placed in an antecubital vein and a baseline venous blood sample was obtained. Subsequently, the test meal was administered and venous blood samples were obtained at 10, 20, 30, 45, 60, 90, 120, and 180 min after consumption of the test meal to measure serum glucose, insulin, and C-peptide.
Test meal
The test meal was a balanced meal consisting of a sandwich of white bread, ham, extra virgin olive oil, and tomato. It had to meet 40% of individual daily energy expenditure, obtained by multiplying the resting energy expenditure estimated with the Harris and Benedicts equation [22] by the level of physical activity, using the coefficients proposed by the Italian Society of Human Nutrition (Società Italiana di Nutrizione Umana, SINU) [22]. The meal also had a fixed macronutrient composition (Table 1). Approximately 60% of calories were derived from carbohydrates, 25% from lipids, and 15% from protein. The meal also provided about 9 g fiber per 1000 kcal. Therefore, based on the study design, meal size was different for each individual. Subjects were asked to consume the entire meal within 15 min. During the test, water was always available to participants.
Anthropometric measurements
Anthropometric measurements were taken following international guidelines [23]. Subjects were asked to undress, remaining with only the light underwear on, in order to measure body weight and height, waist circumference, and body skinfolds. Weight was measured using a column scale (Seca 700 balance, Seca Corporation, Hanover, MD, USA) to the nearest 100 g. Height was measured using a vertical stadiometer with an accuracy of 0.1 cm. Body mass index was then calculated. Waist circumference was measured with a non-stretch tape midway between the lower rib margin and the superior anterior iliac spine taken to the nearest 0.5 cm. Skinfold thicknesses (biceps, triceps, subscapular and suprailiac) were measured by Holtain Tanner/Whitehouse skinfold calliper (Holtain Ltd, Crymych, Wales). Each skinfold was measured three times and a mean was calculated. Body density and fat mass were then estimated by the Durnin and Womersley equation [24] and by the Siri’s formula [25], respectively.
Ultrasonography
Abdominal ultrasonography was performed on individuals in fasting state using a Logiq 3 Pro equipped with a 3.5 MHz convex-array probe and with a 7.5 MHz linear probe (GE Healthcare, Milwaukee, WI, USA). VAT and SAT thicknesses were measured 1 cm above the umbilicus. The measurements were taken at the end of expiration and applying a standardized probe pressure. SAT, defined as the distance between the epidermis and the external face of the rectus abdominis muscle, was measured with the 7.5 MHz linear probe; VAT, defined as the distance between the anterior wall of the aorta and the posterior surface of the rectus abdominis muscle, was measured with the 3.5 MHz convex-array probe [26, 27]. Each measurement was taken three times and the mean was calculated.
Laboratory analysis
Blood glucose and insulin were determined at baseline and at all times mentioned above, and c-peptide was measured at baseline and every thirty minutes up to three hours. All parameters were assayed by commercial kit Roche Diagnostics Italy with Cobas Integra 400 Plus and Cobas 411 (Roche diagnostic, Monza, Italy).
Statistical analysis
Descriptive variables data are reported as mean ± standard deviation. Two sample comparisons between men and women were made using t-test or rank-sum test for data that were not normally distributed. The effect of sex on continuous outcomes (postprandial glucose, insulin, and c-peptide concentrations) was evaluated using linear mixed models employing the sex (0 = women, 1 = men), time, and a sex # time interaction as fixed-effect predictors and the patient as random effect. A P value < 0.05 was considered statistically significant. Statistical analysis was performed using STATA version 12.0 (StataCorp).