The present analyses included 90 national surveys from LMIC’s carried out between 2010 and 2019 (median year = 2014). Countries included in the analyses represented 87.1% of all low-income countries in the world as of 2014, 70.6% of all lower-middle and 50.9% of all upper-middle-income countries. Supplementary Table 1 shows the numbers of children in each income group for all countries included in the analyses.
The median number of children under the age of 5 years with valid anthropometric and age information across all countries was 5920 (IQR = 3263; 10263). The median numbers by age group were as follows: 0–11 months (N = 1101; IQR = 538; 2100), 12–23 months (N = 1137; IQR = 624; 2080), 24–35 months (N = 1151; IQR = 653; 2071), 36–47 months (N = 1192; IQR = 612; 2125), and 48–59 months (N = 1079; IQR = 664; 1997).
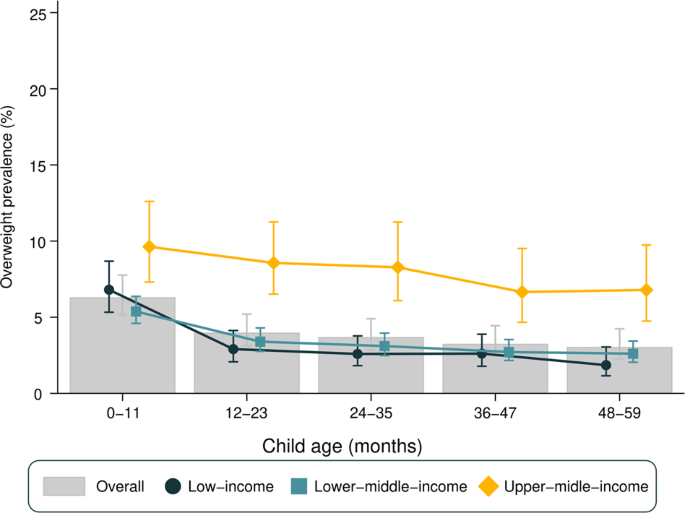
Figure 1 presents overweight prevalence stratified by age and country income groups. Overall, the prevalence of overweight declined with increasing age (heterogeneity p value = 0.03), with a 3.3 percentage points (p.p.) of difference between the 0–11 (6.3%) and the 48–59 months (3.0%) age groups. A similar pattern was observed when stratifying for gender (Supplementary Fig. 1) and using the IOTF classification for overweight (Supplementary Fig. 4).
Overweight prevalence was considerably lower in low-income countries in comparison with upper-middle-income countries regardless of age group (Fig. 1). In low-income countries, overweight prevalence was at least 3.8 p.p. higher in the 0–11 months group than in older age groups (heterogeneity p value < 0.001). In lower-middle-income countries, this difference was at least 2.0 p.p., with a similar decline with age (heterogeneity p value < 0.001). As for upper-middle-income countries, there was an apparent decline in prevalence with age, but it was not as pronounced as in low-income or lower-middle-income countries and did not reach statistical significance (heterogeneity p value = 0.082).
Supplementary Table 2 presents the national prevalence of overweight stratified by age and respective SII values. Overweight prevalence among children aged 0–11 months varied from 1.8% in Mauritania to 23.3% in South Africa, whereas for children aged 48–59 months age the range was from 0.1% in Madagascar to 14.5% in Egypt. Tests for linear trends in overweight prevalence showed statistically significant declines with age in 65 countries and increases with age in only three countries: El Salvador, North Macedonia, and Thailand. For the remaining 22 countries, there was no evidence of a linear trend (Supplementary Table 2). As for national estimates, Senegal was the country with the lowest national overweight prevalence among all under 5 children (0.9%), while the highest prevalence was observed in Bosnia and Herzegovina (18.1%) (data not shown).
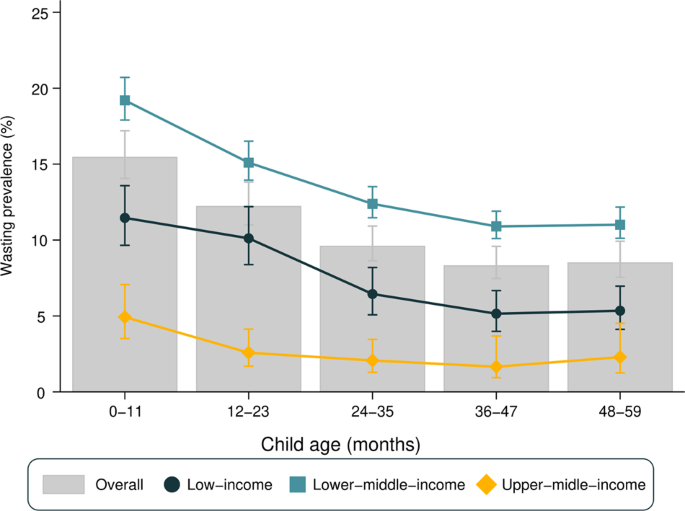
Figure 2 presents wasting prevalence by age and country income groups. Wasting was more frequent among infants (0–11 months), with a slight decrease between the first and second year of life, and little variation thereafter. The same pattern was observed when stratifying for gender (Supplementary Fig. 3). When stratifying for country income groups, upper-middle-income countries presented the smallest prevalence, varying from 4.9% among infants to 1.7% among 3 years olds. Lower-middle-income countries showed the highest prevalence in all age groups (ranging from 19.0% among infants to 10.9% among 3 years olds). In low-income countries, prevalence ranged from 11.5% in infants to 5.2% in 3 years olds. All groups of countries showed a decline with age from infants to 3 years olds, with stability thereafter.
Wasting prevalence among children aged 0–11 months varied from 0.8% in Peru to 28.9% in India, whereas for children aged 48–59 months age the range was from 0.0% in Eswatini to 22.5% in Timor-Leste. Tests for linear trends in wasting prevalence showed statistically significant declines with age in 72 countries and increases with age only in the Maldives. For the remaining 17 countries, there was no evidence of a linear trend (Supplementary Table 3). Regarding national estimates, Peru showed the lowest national wasting prevalence (0.5%) and Timor-Leste the highest (24.0%) (data not shown).
As a consequence of the higher prevalence of both overweight and wasting among younger children, the proportions of children with appropriate WHZ (between −2 and +2 Z scores) increased with age, being approximately to 78, 85, 88, 89, and 90% for age groups 0–11, 12–23, 24–35, 36–47, and 48–59 months, respectively (Supplementary Fig. 6).
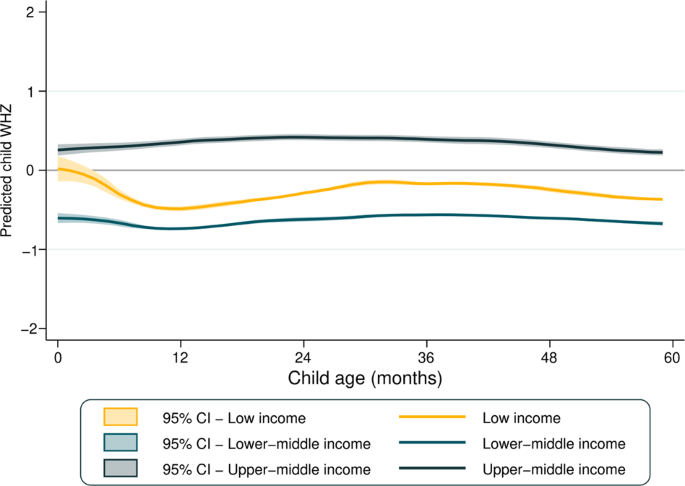
Figure 3 presents the mean WHZ according to country income groups. Regardless of age, upper-middle-income countries showed the highest mean WHZ, which was a little above 0 for all ages. Mean WHZ was stable in lower-middle and upper-middle-income countries, while for low-income countries a decline is observed between 0 and 12 months of age.
In Supplementary Fig. 4, the boxplots show the distribution in all countries studied of WHZ scores and respective standard deviations across age groups. Median values of the national-level WHZ means were close to zero, being similar among all age groups (heterogeneity p value = 0.659), median of the standard deviations of the national-level WHZ means were higher among infants than older children (heterogeneity p value < 0.001), for whom standard deviations were just above 1.0. Out of the 90 surveys included in the present analyses, in 86 the standard deviation for infants exceeded the maximum recommended value of 1.1; the corresponding numbers of surveys exceeding this cutoff were 71, 49, 44, and 41 for children aged 1–4 years, respectively.
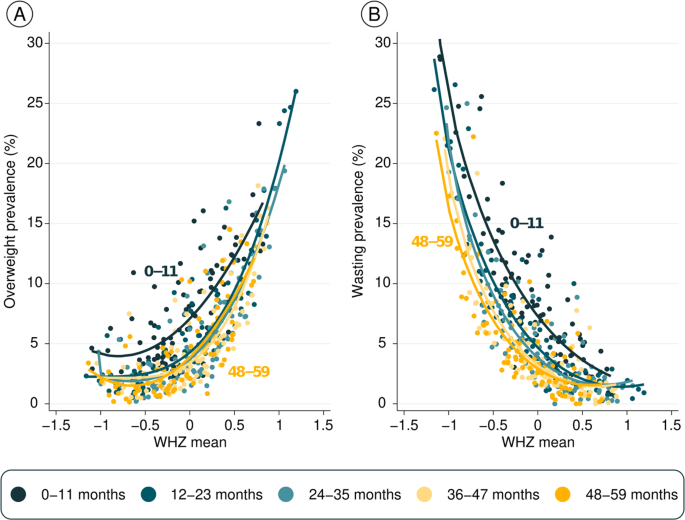
Figure 4 shows prevalence of the two outcomes (overweight and wasting) according to mean WHZ by age. Each dot represents one age group in a country, totaling 450 observations. The fitted curves for infants are well above the curves for older children, showing that the same level of mean WHZ is associated both with higher overweight (Fig. 4A) as well as higher wasting prevalence (Fig. 4B) in infants than for older children. This pattern is due to the wider standard deviations among infants, as shown in Supplementary Fig. 4B.


