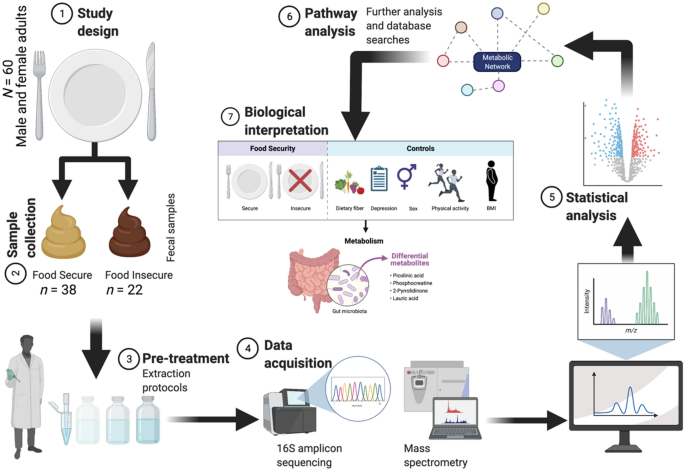
Study design
This is a secondary analysis of a cross-sectional pilot study that examined the impact of social networks on college student nutrition, physical activity, and weight outcomes67. Participants were recruited from three residence halls across one urban campus. Once eligible students were enrolled in the primary study (n = 221), they were given the opportunity to enroll in the devilWASTE study (n = 60). The exclusion criteria for devilWASTE included being under the age of 18, certain gastrointestinal conditions such as malabsorptive disease, history of an eating disorder, antibiotic use 2–3 months prior, and current conditions (diagnosed and/or treated) that affect the microbiome including HIV infection, diabetes, or high blood pressure. Any medications reported by participants were evaluated individually for their ability to robustly influence the gut microbiome, in which case a participant was excluded from participating in the devilWASTE study. Inclusion criteria were living in a residence hall at ASU, English speaking, and participation in SPARC study. Participants provided informed written consent and all study protocols were approved by the Arizona State University Institutional Review Board (STUDY00005882). Additionally, all methods were performed in accordance with the relevant guidelines and regulations.
Food insecurity
Food insecurity was measured using an adaptation of the 2-item food insecurity screener68. The time frame in the validated question was adapted and changed the framing of the question from “we” to “I”, as has been done by others69. Participants were asked, “Within the past month, I worried whether my food would run out before I got money to buy more” and “Within the past month, the food I bought just did not last and I did not have money to get more.” Students giving an affirmative answer to either question were categorized as food insecure in the past month.
Fecal sample collection and DNA extraction
Research staff delivered fecal sample collections kits to the residence halls of eligible participants. Fecal samples were collected at a single timepoint and participants were asked to report any medication and supplement use within the last 3 months. If participants had taken any antibiotics, antifungals, or probiotics within the previous 3 months, a fecal sample was not obtained. Research staff picked up the fecal samples within 30 min of participate reported bowel movement and transported them to the laboratory where they were frozen at − 80 °C until further processing. Frozen samples were thawed at 4 °C, and wet weight was recorded to the nearest 0.01 g after subtracting the weight of fecal collection materials. DNA was extracted from approximately 300 mg of feces, collected from the center of the sample, using a modified version of the manufacturer protocol (MoBio Power Soil DNA Isolation Kit #12888-100, MoBio, Carlsbad, CA). Per manufacturer recommendations, a heating step of 65 °C for 10 min was added to the protocol to reduce the influence of inhibitors commonly found in feces and increase DNA yield. DNA concentration and quality were quantified using QIAxpert System (Qiagen, Germantown, MD) according to manufacturer instructions.
Analyses
Fecal microbiome sequencing and statistical analysis
High-throughput genomic sequencing of the 16S rRNA gene was performed using Illumina miSeq technology after ligating 515F and 806R primers and Illumina adapters via polymerase chain reaction. Negative controls were included and run with the study samples. A detailed report of methods to prepare and sequence DNA has been published18. Raw 16S rRNA sequencing data for all samples have been deposited in the open-source repository “NCBI/Sequence Read Archive (SRA)” under project PRJNA473006 with accession numbers: SAMN09258197–SAMN09258278 (https://www.ncbi.nlm.nih.gov/sra).
Overall, the 16S rRNA sequencing produced 5,259,656 reads with a median of 80,443 reads per sample (per-sample sequence count range: 20,558–197,883). Paired-end, demultiplexed data were imported and analyzed using QIIME 2 software version 2021.8. Upon examination of sequence quality plots, base pairs were trimmed at position 13 and truncated at position 150 and were run through DADA2 to remove low quality regions and construct a feature table using ASVs (Supplemental Fig. S8). Next, the ASV feature table was passed through the feature-classifier plugin, which was implemented using a naive Bayes machine-learning classifier, pre-trained to discern taxonomy mapped to the latest version of the rRNA database SILVA (138.1; 99% OTUs from 515F/806R region of sequences)70. Based on assessment of alpha rarefaction (p-min-depth = 10 and p-max-depth = 120,000) a threshold of 22,000 sequences/sample was established leaving 58/60 high quality samples (participants DW09 and DW96 were removed). A phylogenic tree was then constructed using the fragment-insertion plugin at a p-sampling depth of the rarefaction threshold to impute high-quality reads and normalize for uneven sequencing depth between samples.
Diversity analyses were conducted with the diversity plugin. Alpha diversity (intra-community diversity) was measured using richness (Shannon, Faith’s PD and observed features) and evenness (Pielou’s E) indexes. Beta diversity (inter-community diversity) was measured using Jaccard, Bray–Curtis, Unweighted UniFrac distance (qualitative measure), and Weighted UniFrac distance (quantitative measure). GLM and Adonis analyses were used to test for significant differences (alpha = 0.05) between FS and FI status for alpha and beta diversity metrics, respectively. Both statistical models incorporated the covariates sex, BMI, fiber intake, and self-reported depression and MVPA.
Differential abundance was calculated using Songbird (v1.0.126) in QIIME 229. Specifically, differentials were computed (parameters: –p-epochs 10,000 –p-differential-prior 0.5 –p-summary-interval 1 –num-random-test-examples 10% of samples) based on FS and FI status and accounting for the covariates sex, BMI, fiber intake, and self-reported depression and MVPA. Qurro (v0.4.027) was then used to compute log ratios of ranked features30. Evaluation of the Songbird models against a baseline model obtained a pseudo-Q2 value of 0.183. The top 10 lowest and highest ranked differential features were selected and a Mann–Whitney U test and Cohen’s d were calculated to assess the significance (alpha = 0.05) and effect size of the log ratios.
To examine the correlation between taxa at the genus level by food security status the SparrCC algorithm using FastSpar was implemented to render a network analysis with a correlation threshold of 0.6 or − 0.6 (# of permutations = 99; alpha = 0.05)31. Importantly, SparCC assumes network sparsity and uses a log-ratio transformation, performing iterations to identify taxa pairs that are outliers to background correlations. Next, correlation pattern searches were used for the dominant taxa, with individual correlations assessed using a FDR correction (q < 0.05). Both a correlation network analysis and correlation pattern search were employed using MicrobiomeAnalyst71.
The PICRUSt 2 pipeline32 was implemented in order to predict the function of fecal microbiota. Output for the level 3 of the KEGG were analyzed using Songbird (v1.0.126) in QIIME 2 as previously described for the differential abundance analysis. Evaluation of the Songbird models against a baseline model obtained a pseudo-Q2 value of 0.210. The top 10 lowest and highest ranked differential features were selected and a Mann–Whitney U test and Cohen’s d were calculated to assess the significance (alpha = 0.05) and effect size of the log ratios.
Metabolomics analysis
LC–MS grade acetonitrile (ACN), methanol (MeOH), and ammonium acetate (NH4Oac) were purchased from Fisher Scientific (Pittsburgh, PA), while ammonium hydroxide (NH4OH), O-methylhydroxylamine hydrochloride (MeOX), and N-Methyl-N-(tert-butyldimethylsilyl) trifluoroacetamide (MTBSTFA) were bought from Sigma-Aldrich (Saint Louis, MO). Deionized water was sourced in-house by a water purification system from EMD Millipore (Billerica, MA). Phosphate buffered saline (PBS) was procured from GE Healthcare Life Sciences (Logan, UT). Standard compounds corresponding to measured aqueous metabolites were purchased from Sigma-Aldrich and Fisher Scientific. Lipid standards used in this study were purchased from Fisher Scientific, Sigma-Aldrich, and Avanti Polar Lipids (Alabaster, AL).
Prior to LC–MS/MS targeted analysis, frozen fecal samples were first thawed overnight under 4 °C. Afterward, 20 mg of each sample were placed in a 1.5 mL Eppendorf vial. Protein precipitation and metabolite extraction was performed by adding 500 μL MeOH and 50 μL internal standard solution (containing 1810.5 μM 13C3-lactate and 142 μM 13C5-glutamic acid). The mixture was then vortexed for 10 s and stored at − 20 °C for 30 min; afterward, samples were centrifuged at 14,000 RPM for 10 min at 4 °C. The supernatants (450 μL) from these samples were collected into new Eppendorf vials and dried using a CentriVap Concentrator (Fort Scott, KS). Dried samples were then reconstituted in 150 μL of 40% PBS/60% ACN and centrifuged again at 14,000 RPM at 4 °C for 10 min. Finally, 100 μL of supernatant was collected from each sample into an LC autosampler vial for subsequent analysis. A pooled sample, which was a mixture of all experimental samples, was used as the quality control (QC) sample and injected once every 10 experimental samples.
The targeted LC–MS/MS method used here is detailed elsewhere72,73. Briefly, all LC–MS/MS experiments were performed using an Agilent 1290 UPLC-6490 QQQ-MS system. Each sample was injected twice, 10 µL for analysis using negative ionization mode and 4 µL for analysis using positive ionization mode. Both chromatographic separations were performed in hydrophilic interaction chromatography (HILIC) mode on a Waters Xbridge BEH Amide column (150 × 2.1 mm, 2.5 µm particle size; Waters Corporation, Milford, MA). The HILIC parameters were as follows: flow rate was 0.3 mL/min, auto-sampler temperature was kept at 4 °C, and the column compartment was set to 40 °C. The mobile phase for LC separations was composed of Solvents A (10 mM NH4Oac, 10 mM NH4OH in 95% H2O/5% ACN) and B (10 mM NH4Oac, 10 mM NH4OH in 95% ACN/5% H2O). After an initial 1 min isocratic elution of 90% B, the percentage of Solvent B decreased to 40% at t = 11 min and was maintained at 40% for 4 min (t = 15 min), after which the percentage of B gradually went back to 90%, to prepare for the next injection. The mass spectrometer was equipped with an electrospray ionization (ESI) source and targeted data acquisition was performed in multiple-reaction-monitoring (MRM) mode. All aspects of the LC–MS system was controlled by Agilent MassHunter Workstation software. Subsequently, the extracted MRM peaks were integrated using Agilent MassHunter Quantitative Data Analysis software.
Prior to GC–MS analysis of SCFAs, frozen fecal samples were first thawed overnight under 4 °C. Then, 20 mg of each sample was homogenized with 5 μL hexanoic acid-3,3,3 (internal standard), 15 μL sodium hydroxide (NaOH [0.5 M]), and 500 μL MeOH. Samples were then stored at − 20 °C for 20 min and centrifuged afterward at 14,000 RPM for 10 min. Next, 450 μL of supernatant were collected and sample pH was adjusted to 10 by adding 30 μL of NaOH:H2O (1:4, v:v). Samples were then dried, and the residues were initially derivatized with 40 µL of 20 mg/mL MeOX solution in pyridine under 60 °C for 90 min. Subsequently, 60 µL of MTBSTFA containing d27-mysristic acid were added, and the mixture was incubated at 60 °C for 30 min. The samples were then vortexed for 30 s and centrifuged at 14,000 RPM for 10 min. Finally, 70 µL of supernatant were collected from each sample and injected into new glass vials for GC–MS analysis.
GC–MS conditions used here were adopted from a previously published protocol74,75. Briefly, GC–MS experiments were performed on an Agilent 7820A GC-5977B MSD system (Santa Clara, CA); all samples were analyzed by injecting 1 µL of prepared samples. Helium was the carrier gas with a constant flow rate of 1.2 mL/min. Separation of metabolites was achieved using an Agilent HP-5 ms capillary column (30 m × 250 µm × 0.25 µm). Ramping parameters were as follows: column temperature was maintained at 60 °C for 1 min, increased at a rate of 10 °C/min to 325 °C, and then held at this temperature for 10 min. Mass spectral signals were recorded at an m/z range of 50–600 and data extraction was performed using Agilent Quantitative Analysis software.
Following peak integration, metabolites were filtered for reliability and only those with QC CV < 20% and relative abundance of 1000 in > 80% of samples were retained for statistical analysis. The acquired data were then square root transformed and auto scaled prior to analysis. Linear modelling was performed using SPSS 28.0 (SPSS Inc., Chicago, IL), while multivariate statistical analyses were performed using open-source R software.
Microbiome and metabolome integration and co-occurrence analysis
Probabilities of cooccurrence between fecal taxa and metabolites was conducted using mmvec (v1.0.2), a neural network solution inspired from natural language processing76. A log-transformed conditional probability matrix from each cross-omics feature pair was constructed and a singular value decomposition was applied in order to represent cooccurrence. These are displayed as rank values in Supplementary Table S4.
Covariates
There were several covariates that were accounted for in our analyses based on previous studies demonstrating a significant impact on gut microbiota composition.
Demographic data
Participant gender was provided via a self-reported, web-based questionnaire that was completed upon entry to the parent study. Participants were asked their sex. Height and weight measurements were obtained using Seca stadiometers (model 217) and Seca flat scales (model 874 or 869, respectively, by trained research staff. Measures were taken in triplicate with the two closest values (i.e., within 0.5 cm and 0.5 kg) averaged. The averaged values were used to calculate BMI to the nearest kg/m2. CDC BMI guidelines were used to categorize participants as normal weight (BMI ≥ 18.5 kg/m2 and ≤ 24.9 kg/m2), overweight (BMI ≥ 25.0 kg/m2 and ≤ 29.9 kg/m2), or obese (BMI ≥ 30.0 kg/m2).
Depression
Students were asked “How often in the past 1 month have you felt: (1) Things were hopeless?; (2) Overwhelmed by all you had to do?; (3) Very lonely?; (4) Very sad?; (5) So depressed that it was difficult to function?; (6) Overwhelming anxiety? (Response options: never, rarely, sometimes, often)”.
Fiber intake
The ASA24 24-h dietary recall was used to assess students’ habitual dietary intake. Food and beverage intake was recorded from midnight to midnight on the previous day. Participants were asked to complete 3 days of dietary recall (2 weekdays and 1 weekend day) which has been previously validated77,78. The ASA24 uses the U.S. Department of Agriculture’s Automated Multiple Pass Method (AMPM)79 and measures intake by using the USDA’s Food and Nutrient Database for Dietary Studies (FNDDS). Using data from the ASA24-2014, we examined total fiber intake.
Physical activity
Physical activity habits were determined using the Godin-Shephard Leisure-Time Physical Activity Questionnaire which has been validated as an appropriate method to measure physical activity habits among college students80. The amount of time participants’ spent engaged in moderate and vigorous exercise was obtained by asking “In a usual week, how many hours do you spend doing the following activities:” with the question endings of strenuous, moderate, and mild exercise. Response options ranged from “None” to “more than 6 h per week”. The amount of moderate-to-vigorous physical activity was calculated by totaling the time reported in moderate and strenuous exercise.
Ethics statement
This study included the participation of human volunteers. All protocols and consenting procedures were reviewed and approved by the Arizona State University Institutional Review Board. Written informed consent was obtained from all participants and a copy of the signed consent form was provided to each participant for their records. Each participant was informed that their participation was voluntary and could be stopped at any time. Identifying information (e.g., names) for participants have been removed from all text, figures, tables, and images to ensure their anonymity.