Nutrition intake during intervention
To reduce the impact of daily dietary intake on gut microbiota, all participants were required to repast at a specific dining hall and record their food for calculating the daily intake of energy, protein, fat, and carbohydrate at the sampling weeks (week 0 and week 8), for which there were no significant differences (P > 0.05) in micronutrient intake (Supplementary Table 3), while the intake of FHV roots in two treatment groups was distinctly different (P < 0.001), as presented in Supplementary Table 1. Besides, a preliminary experiment of FHVD intervention was conducted within 9 individuals. However, little significant difference of blood biochemicals was found as presented in Supplementary Table 4.
Gut microbial taxonomy alteration in the Ficus hirta Vahl diet
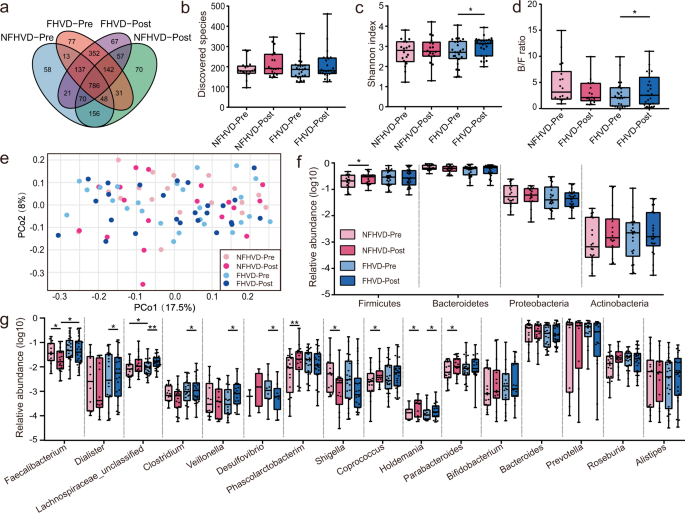
After 8 weeks of intervention, genomic DNA was extracted from each of 86 fecal samples for 16S rRNA gene sequencing of the V4 region to examine the gut microbiota. The Shannon curve indicated that the sequencing depth covered virtually the full range of the gut microorganisms (Supplementary Fig. 2). A total of 2085 OTUs were identified according to Fig. 1a, of which 58, 70, 77, and 67 OTUs were characteristic among NFHVD-Pre, NFHVD-Post, FHVD-Pre, and FHVD-Post, respectively. In addition, the FHVD influence on the amount and proportion of bacteria was assessed in individuals by the discovered species and Shannon index, as shown in Fig. 1b, c. The number of species in the two treatment groups were not significantly different, but there was a slight significant increase of Shannon index after FHVD intervention. Then, we assessed the gut microbiota composition through principal co-ordinate analysis over the unweighted UniFrac distance (Fig. 1e), none of the changed beta diversities were significantly different between groups during intervention (P > 0.05).
Variations in (a) Venn diagram of the overlap at OTU level. (b) The discovered species. (c) The alpha diversity (Shannon index). (d) The Bacteroidetes/Firmicutes ratio. (e) Overall gut microbial structure, principal co-ordinates analysis based on the Bray-Curtis distance. (f) The relative abundance on phylum level. (g) The relative abundance on genus level. FHVD-Pre (n = 25), FHVD-Post (n = 25), NFHVD-Pre (n = 18), and NFHVD-Post (n = 18). OTU, Operational Taxonomic Unit. Wilcoxon matched pair signed-rank tests (two tailed) were used to analyze pairwise Pre and Post within diets. A Mann-Whitney test was used to analyze differences between the FHVD and NFHVD groups at the same time point. *P < 0.05 and **P < 0.01. The bounds, whiskers and percentile of each box plot represented maximum, 75 percentile, median, 25 percentile and minimum from the top to the bottom respectively.
The taxa changes were further investigated at different classification levels horizontally and vertically in different cohorts. Specially, At the phylum level (Fig. 1f), the predominant taxa were Firmicutes, Bacteroidetes, Proteobacteria, and Actinobacteria. In particular, the relative abundance of Firmicutes showed a significant increase after NHFVD intervention (P = 0.0385), while other phyla showed no significant changes. As shown in Fig. 1d, the B/F ratio decreased after NFHVD intervention, with no significant difference (P = 0.0814), but significantly increased after the FHVD intervention (P = 0.0105).
At the genus level (Fig. 1g), there were 16 dominant genus taxa in healthy individuals. The high-abundance of Bacteroides and Prevotella were not obviously changed by FHVD intervention. Faecalibacterium, was significantly reduced with the NFHVD (P = 0.0268) but recovered with the FHVD by horizontal comparison (P = 0.0389). In addition, the abundances of Dialister (P = 0.0499), Veillonella (P = 0.0163), and an unclassified Lachnospiraceae organism (P = 0.0001) were increased specifically by the FHVD. Both diets increased the abundance of Coprococcus after intervention, but it only showed significance in the NFHVD (P = 0.0385). Holdemania was the only taxon that was significantly enriched by both the NFHVD and FHVD. In addition, Shigella and Desulfovibrio were found to had a similar reducing tendency in the FHVD, however, only the latter (P = 0.0163) showed significant difference.
Co-occurrence network differences between diet interventions
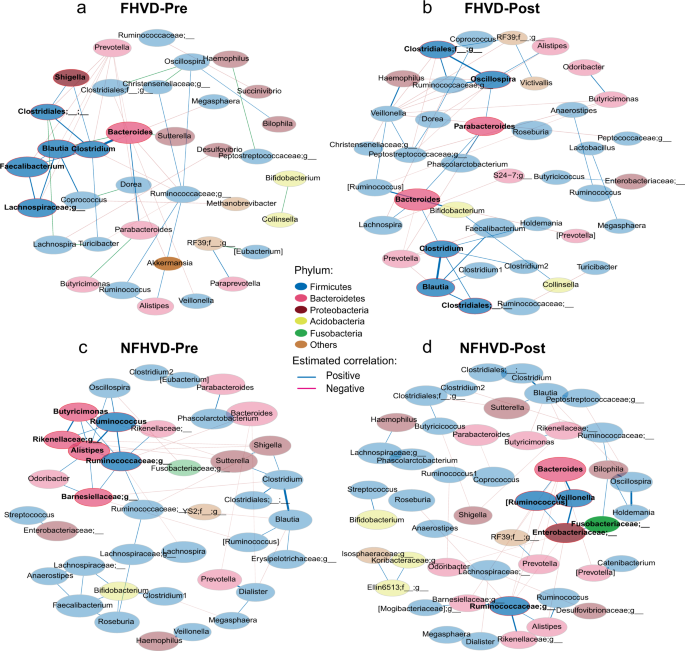
Next, to investigate the patterns of interactions between gut microbial communities, the co-occurrence networks of the FHVD and NFHVD were constructed based on 16S rRNA gene sequencing data (Fig. 2). A total of 35 and 41 nodes were discovered in FHVD-Pre and -Post respectively, including 21 mutual nodes. For another, 39 and 49 nodes were found in NFHVD-Pre and -Post severally with 29 shared nodes in two groups. In addition, significant correlations including 28 positive and 16 negative correlations were revealed before the FHVD, while the number changed to 29 positive and 22 negative after the intervention. For the NFHVD, 35 positive and 16 negative correlations were revealed before the intervention, followed by 25 positive and 23 negative correlations after the NFHVD. Notably, the core taxa showed slight variation, with disappearance of Shigella, Sutterella, Desulfovibrio, and appearance of Parabacteroides in the FHVD.
Metabolic function variation of gut microbiota in the Ficus hirta Vahl diet
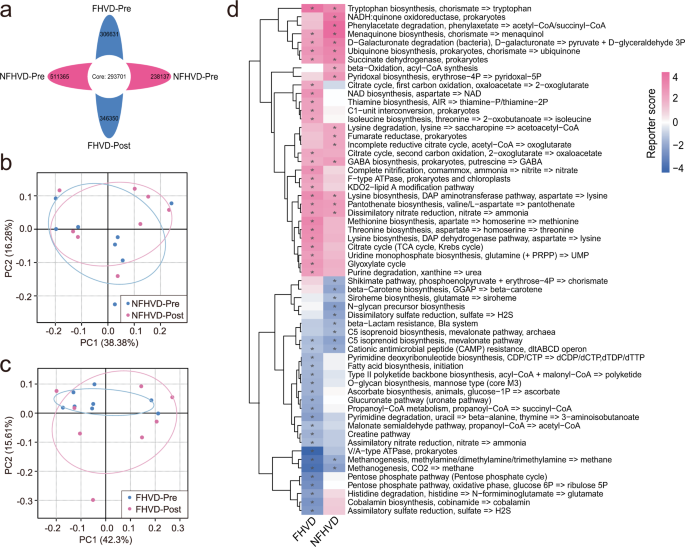
More recently, MicroPITA was commonly applied to select specific samples from microbiome data to gain insight into the mechanism by which the gut microbiome may interact with the host16,17. Based on the 16S rRNA gene sequencing results of 86 samples, we selected 32 typical fecal samples (8 samples in each group) by supervised method to conduct metagenomic sequencing. In total, 293701 core genes were detected. 511365, 238137, 306631, and 346350 feature genes were observed in NFHVD-Pre, -Post, FHVD-Pre, and -Post, respectively (Fig. 3a). Principal component analysis (PCA) in different cohorts showed that the sample variation of the FHVD (Fig. 3c) was distinctly higher than that of the NFHVD (Fig. 3b). These genes belonged to 7256 KEGG Orthologs (KOs) and were distributed in 259 metabolic pathway modules. Furthermore, 69 KEGG pathway modules (34 enriched) showed significant differences in the FHVD, and 58 modules (29 enriched) were significantly changed by the NFHVD. The variation in the corresponding KEGG modules is displayed in Fig. 3d, and significance were shown according to the reporter score (|reporter score | > 1.65) of each module.
Changes in (a) Venn diagram of the gene counts. PCA (Principal Components Analysis) plot of (b) NFHVD and (c) FHVD based on Bray–Curtis distance according to KEGG Ontology (KO) profiles. (d) Microbial metabolic module alternation in FHVD and NFHVD. Asterisk denotes reporter score (RS) of module > 1.65 or < −1.65 were considered to be significant. Pink, enriched by after intervention; Blue, enriched before intervention.
Particularly, The FHVD had a higher abundance of the synthesis pathways involving vitamin B1 (thiamine, RS = 1.932), B5 (pantothenate, RS = 2.313), and K2 (menaquinone, RS = 1.938), while the latter was only enriched by the NFHVD (RS = 3.843). Besides, NAD synthesis (RS = 2.463), citrate cycle (RS = 2.345), and the glyoxylate cycle (RS = 2.275) were enhanced by the FHVD. In contrast, the pentose-phosphate pathway was significantly decreased (RS = 3.194). The enhanced pathways from essential amino acids synthesis, including threonine (RS = 2.615), methionine (RS = 2.879), tryptophan (RS = 3.551), lysine (RS = 2.583), and isoleucine (RS = 1.840), was profiled in the FHVD, while only tryptophan (RS = 2.693) and lysine (RS = 1.843) were enriched by the NFHVD.
Widely targeted metabolic profiles difference in the Ficus hirta Vahl diet
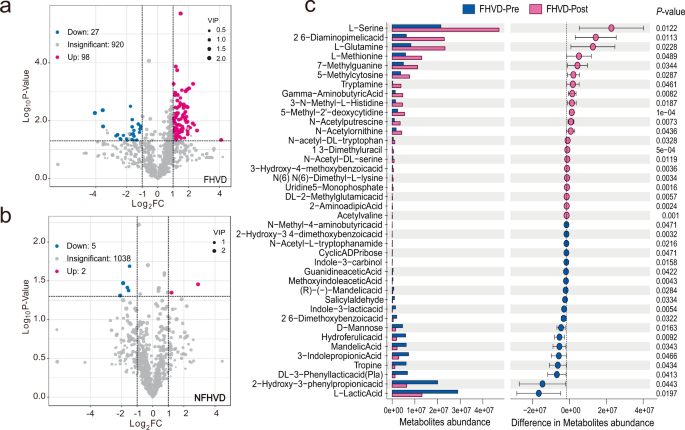
To further reveal the metabolic functional variation driven by the FHVD, widely targeted metabolic profiles were used to evaluate the effect of the FHVD on the host metabolite profiles from fecal samples. In this part, the variable importance in projection (VIP) scores were applied to estimate the enrichment or reduction in metabolites through intervention with the two diets. It was observed that the widely significant changes were enriched with 98 metabolites and downregulated with 27 metabolites by the FHVD, while a few changes were observed after the NFHVD: an increase in 2 metabolites and a reduction in 5 (Fig. 4a, b). The significant changes in the abundance of the main metabolites are shown in Fig. 4c. In particular, the FHVD mainly contributed to metabolites such as l-serine (P = 0.0122), l-methionine (P = 0.0489), gamma-aminobutyric acid (GABA, P = 0.0083), l-glutamine (P = 0.0228), and tryptamine (P = 0.0461). Other metabolites received little attention because of the fewer report with host health and gut microbiota.
Concentration and gene abundance variation of short-chain fatty acid in the Ficus hirta Vahl diet
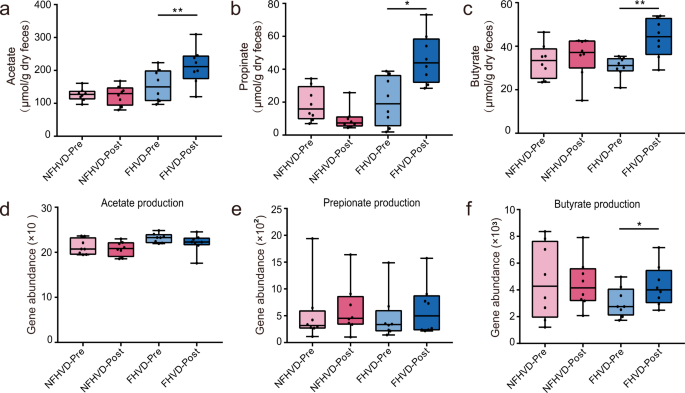
Our study also showed clear relevant changes in a number of gut microbial fermentation metabolites. As shown in Fig. 5a–c, acetate (P = 0.0122), propionate (P = 0.0122), and butyrate (P = 0.0122) were distinctly improved by the FHVD but not by the NFHVD. Meanwhile, there was an increase in the key gene abundance of the butyrate synthesis pathway in the FHVD (P = 0.0391), although no significant changes were observed in acetate and propionate production (Figs. 5d–f). Next, the nutrient contents in water extract of FHV was measured Supplementary Fig. 3), including total sugar, protein, flavonoid, and polyphenol. The results showed that FHV provided a larger amount of carbohydrate than other components. In-vitro fermentation of FHV extract by the human gut microbiota also showed significant increases in acetate, propionate, and butyrate (Table 1).
Changes in fecal concentrations of (a) acetate, (b) propionate, and (c) butyrate. Changes in the abundance of genes that encode the key enzymes in (d) acetate production [formate-tetrahydrofolate ligase fhs and acetate kinase ack], (e) propionate production [lactoyl-CoA dehydratase lcd, propionaldehyde dehydrogenase pduP, and methylmalonyl-CoA decarboxylase mmd], and (f) butyrate production [butyryl–coenzyme A (butyryl-CoA):acetate CoA transferase but and butyrate kinase buk]. The bounds, whiskers and percentile of each box plot represented maximum, 75 percentile, median, 25 percentile and minimum from the top to the bottom respectively.
Association analysis of Gut gut metagenome associated with feature metabolites in FHVD
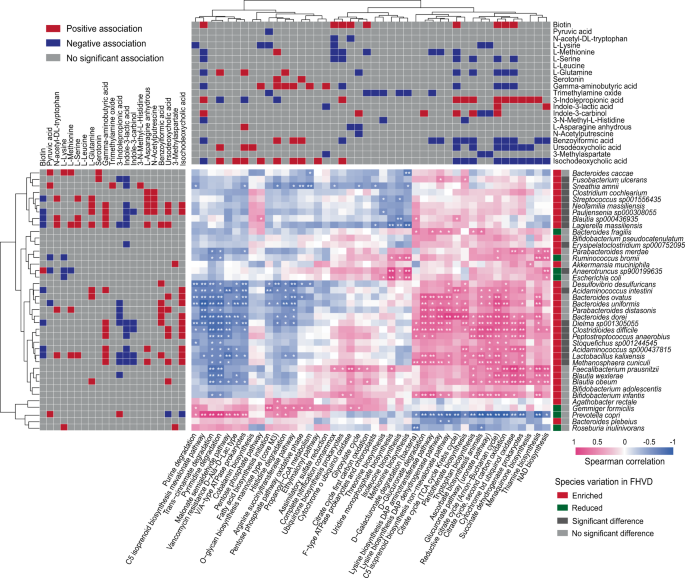
A total of 41 pathways were significantly correlated with 21 metabolites and 18 significantly enriched species, which highlighted the importance of microbial functions and taxa in interactions with fecal metabolites to affect host health (Fig. 6). For instance, biotin was positively correlated with the citrate cycle and coenzyme synthesis, while less significance was found in association with enriched species. Most of essential amino acids were positively correlated with FHVD-enriched species, such as Streptococcus spp., Blautia spp., and Lactobacillus kalixensis, while the latter was only significantly co-enriched with Methionine. Besides, GABA levels were positively associated with a wide range of enriched species, especially acid-production bacteria such as Blautia spp., Lactobacillus spp., and Acidaminococcus spp. Moreover, the citrate cycle and vitamin synthesis pathways exhibited a positive correlation with Bacteroides dorei, Ruminococcus bromii, and Blautia obeum, while few metabolites showed distinct correlation with these pathways.

