Results from ICA
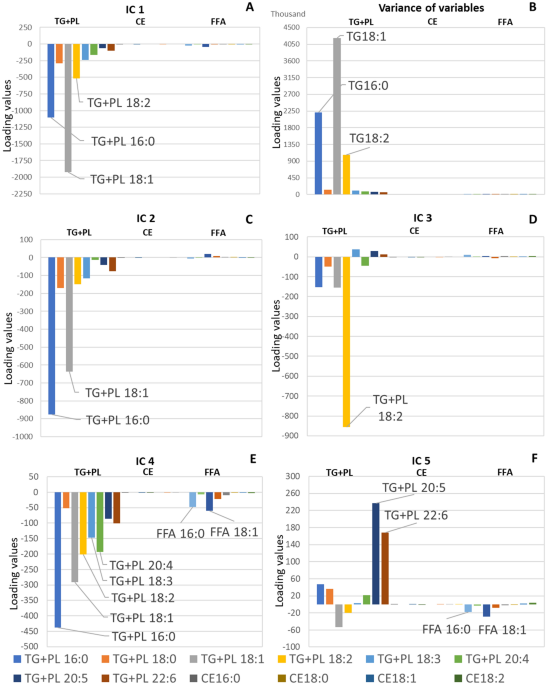
In the results of ICA, outcomes of ICA model with five components generated the outcomes meet our expectation best. As to the first independent component (IC 1) (Fig. 1A), the histogram displayed that variables with high loading values were TG + PL 18:1n-9 and TG + PL 16:0, which are commonly with highest concentration in plasma. Additionally, the variation value of each subtype is in the same order as the value of IC 1 (Fig. 1B), thus IC 1 was regarded as size factor.

Histograms of independent component analysis results, including (A) IC 1, (B) variance of variables, (C) IC 2, (D) IC 3, (E) IC 4, and (F) IC 5. The omega groups of FAs were omitted.
The histogram of the second independent component (IC 2) displayed that variables with high loading values were TG + PL 16:0 and TG + PL 18:1n-9 (Fig. 1C), which can be obtained from animal fats and synthesized in human body. Since, the loading values of FFAs, which are influenced either by dietary intake or adipose tissues lipolysis8,27, are extremely low in IC 2, thus we regarded the IC 2 as representation of the endogenous fatty acids.
The histogram of the third independent component (IC 3) (Fig. 1D) displayed that TG + PL 18:2n-6, which cannot be synthesized in human body, was with highest loading value. Dietary sources of FA 18:2n-6 are generally vegetables, nuts, and seeds. Moreover, we found that other essential FAs, which are obtained from meat, were with low loading values. Therefore, it is reasonable to consider IC 3 as the representation of plant oil intake28,29.
In the histogram of forth independent component (IC 4) (Fig. 1E), we found that the loading values of FFA 16:0 and FFA 18:1n-9 were also relatively high compared with those in first three independent components. This situation informed us that IC 4 could the biomarker to reflect exogenous FAs, because FFAs are known to reflect food intake during fasting. More precisely, the main sources of serum FFAs are food intake, liver synthesis and adipose lipolysis during fasting8. Nevertheless, mobilization of serum FFA from adipose tissues was reported to be selective, thus, we thought that serum FFA variables only serves as a biomarker to mark the exogenous FAs17,27. In addition, the histogram of IC4 also displayed that TG + PLs 16:0, 18:1n-9, 18:2n-6, 20:4n-6 and 18:3 (omega group was not given because of the presence of 18:3n-3 and 18:3n-6) were with relatively high loading values. TG + PL 16:0 and TG + PL 18:1n-9 can be synthesized in human body as well as obtained from food intakes. TG + PLs 18:2n-6, 18:3, and 20:4n-6 are regarded as essential FAs, which need to be gained from food intakes. The common point of those FAs source is their exogenous source, which confirmed us that TG + PL variables in IC 4 can reflect the exogenous FAs. To specify the sources of exogenous FAs, we calculated the correlation coefficients between loading values of TG + PL variables and reported adipose FA composition for Japanese, which is low ((rho =0.61))30. Therefore, we refused the assumption that IC 4 reflects the adipose composition but accepted the suppose that IC 4 represents exogenous FAs. According to the correlation coefficients between loading values of TG + PL variables and published food FA concentration, we deemed the major exogenous FA sources is animal meat fat29. The details concerning exact food sources will be described in the discussion part of this paper.
The histogram of fifth independent component (IC 5) presented that TG + PL 20:5n-3 and TG + PL 22:6n-3 were with high loading values (Fig. 1D). TG + PL 20:5n-3 and TG + PL 22:6n-3 are eicosapentaenoic acid (EPA) and docosahexaenoic acid (DHA), which are derived from fish oil. Furthermore, FFA 16:0 and FFA 18:1n-9, influenced by food intake and adipose tissues lipolysis, were with relatively high loading values compared with the first three components. Therefore, the IC 5 was judged to represent fish oil intake.
Results from factor analysis
In the result of factor analysis, the model with 6 factors generated the best result. Therefore, we only explain the model generating 6 factors. The histogram of first factor (Factor 1) displayed that variables with high loading values were TG + PL 18:1n-9 and TG + PL 16:0 (Fig. 2A), which are the variables with highest concentration in serum. Therefore, Factor 1 was considered as the size factor for the same reason as we explained in the description (Fig. 1B).

Histograms of factor analysis results, including (A) Factor 1, (B) Factor 2, (C) Factor 3, (D) Factor 4, (E) Factor 5, and (F) Factor 6.
The histogram of the second factor (Factor 2) displayed that variables with high loading values were TG + PL 16:0 and TG + PL 18:1n-9 (Fig. 2B), which can be synthesized in human body. Besides, the loading values of FFA was in low level. Therefore, Factor 2 was judged to represent endogenous FAs.
The histogram of the third factor (Factor 3) presented that TG + PL 18:2n-6 was with extremely high loading value (Fig. 2C). Thus, Factor 3 was deemed to represent plant oil intake for the same reason in the former sections.
The histogram of the fourth factor (Factor 4) displayed that variables with high loading values were TG + PL 16:0 and TG + PL 18:1n-9 (Fig. 2D). In addition, the loading values of FFA 18:1n-9 and FFA 16:0 were also comparatively high, therefore Factor 4 was considered to reflect the animal fat intake with the same reason in the description of ICA results.
The histogram of the fifth factor (Factor 5) exhibited that variables with high loading values were TG + PLs 16:0, 20:5n-3 and 22:6n-3 (Fig. 2E). TG + PL 20:5n-3 and TG + PL 22:6n-3 are majorly obtained from fish oil intake, thus Factor 5 was considered to represent fish oil intake.
The histogram of the sixth factor (Factor 6) displayed that variables with high loading values were TG + PLs 18:2, 20:4n-6 and 18:1n-9, which are in ω-6 group (Fig. 2F). TG + PL 20:4n-6 can be generated from TG + PL 18:2n-6 after elongation and desaturation synthesis. Thus, Factor 6 was claimed to represent ω-6 group metabolism.
Results from CPCA
In CPCA, TG + PL, FFA, and CE were combined as one set, which was denoted as FA. The histogram of the first common principal component (CPC1) displayed that variables with high values were FAs 18:1n-9, 16:0 and 18:2n-6, whose concentration is commonly high in serum (Fig. 3A). It is considered as size factor for the same reason in the explanation of IC1 (Fig. 1B).

Histograms of CPCA results, including (A) CPC1, (B) CPC2, (C) CPC3, and (D) CPC4.
The histogram of the second common principal component (CPC2) displayed that variable with high value was FA 18:2n-6 (Fig. 3B). On the contrary, FA 16:0 and FA 18:1n-9 were with low loading values in CPC2. Therefore, CPC2 was judged as the representation of plant oil intake.
The histogram of the third common principal component (CPC3) displayed that variables with high values were FA16:0 and FA18:1n-9 (Fig. 3C). Furthermore, the arrows of FA 16:0 and FA 18:1n-9 were in converse directions, which might indicate the inverse relationship between the two FAs in the inner synthesis process31. Besides, the concentration of serum FA 16:0 and FA 18:0 in common diet group was found similar to those in vegan group32. This situation is caused by the self-producing ability of non-essential FAs in our body. Thus, it is hard for us to judge the FA 16:0 and FA18:0s’ sources with CPCA. We supposed CPC3 could be either the representation of inner non-essential FAs metabolisms or the representation of meat fat intake.
As to the fourth common principal component (CPC4) (Fig. 3D), the CPC4 axis displayed that variables with high values were FAs 20:5n-3, 20:4n-6 and 22:6n-3. Concentration of FA 20:5n-3 and FA 22:6n-3 are high in fish oils, and FA 20:4n-6 can be partly gained from fish33. Therefore, CPC4 was deemed to represent fish oil intake.
There are other four common principal components in our study, but the loading values of them are unclear. Thus, we do not explain the representation of the rest common principal components.
Results from PCA
In the results of PCA, the histogram of first principal component (PC1) showed that variables with high loading values were TG + PL 18:1n-9 and TG + PL 16:0 (Fig. 4A). Therefore, it was considered as size factor for the same reason in the explanation of ICA. The histogram of the second principal component (PC2) displayed that variables with high loading values were TG + PL 18:2n-6, thus PC2 was considered as plant oil intake.

Histograms of PCA results, including (A) PC1, (B) PC2, (C) PC3, and (D) PC4.
As to the third principal component (PC3), the histogram (Fig. 4B) displayed that TG + PL 16:0 and TG + PL 18:1n-9 were with high loading values but in converse directions. We thought PC3 probably reflect the metabolism of TG + PL 16:0 and TG + PL 18:1n-9. However, TG + PL 20:5n-3 and TG + PL 22:6n-3 were with relatively high loading values in PC3, thus we found it is difficult to explain PC3.
The histogram of the fourth principal component (PC4) exhibited that variables with high loading values were TG + PLs 20:5n-3, 22:6n-3, 16:0 and 20:4n-6 (Fig. 4C). Thus, PC4 was considered to represent fish oil intake. We do not explain principal components after PC4 in this study because they were considered obscure (Fig. 4D).
Results of correlation coefficients between food FA concentration and loading values in ICA
In addition, we specified the food sources by correlation coefficient (CC) between the loading values of IC 3, IC 4, and IC 5 and the standard tables of food composition in Japan, 201529. In this process, the foods with the top 10 highest CC values in four major food groups, namely, animal foods, dairy products, marine foods, and plants, were selected as the potential food sources (Supplementary). For animal foods, animal meats and dairy products were studied separately (Fig. 5A,C). For plant FA sources, fruits, mushrooms, vegetables and beans (including Tofu and Miso) were studied (Fig. 5B).

Diagram of suggested food sources. We calculated the correlation coefficients (CCs) between the loading values in the ICA results and the published FA composition in foods29. Then, we selected the foods with the top 10 highest CCs in four major food sources of animal meats (A), plants (B), dairy products (C), and marine foods (D).
According to the CC values, the main food sources of animal meats were suggested as pork leg, chicken breast with skin, boiled chicken breast, meat pork cutlet, beef leg, and loin bacon (Fig. 5A). As to the plant oil sources, the main food sources were suggested as tofu, mushrooms, carrot, onion, and so on (Fig. 5B). As to the food sources of dairy FAs, the main food sources were suggested as cheeses, yogurt, skimmed milk, sherbet and Lacto ice (a common Japanese ice-cream containing milk-solids content of 3% or greater) (Fig. 5C). As to the marine food sources, the main food sources were suggested as sardines, squids, scallops, and octopus (Fig. 5D), although salmon, tuna, or other commonly eaten fishes in Japan were not suggested. It is because sardines serve as forage food for other fishes34, and because sardines are the most common fish in the fishery industry, as it accounted for 23% of the total fish capture amount in 2015, Japan35.