Application development
The application took 6 months to build including creation of the databases, development of the design with a software engineer, and validation of the application. The development process involved professionals from the fields of nutrition and dietetics, and information technology. A total of 368 food items were included in the application as follows: appetizers (46 items), beverages (10), breads (12), dairy products (11 items), desserts (55 items), fats (9 items), fruits (25 items), grains (9 items), legumes (11 items), main meals (83 items), meats (7 items), nuts and seeds (11 items), salads (19 items), salty snacks (9 items), vegetables (26 items), and miscellaneous (9 items), ready to eat items (e.g., chocolate, chips, candies) (16 items). Moreover, the name of each food item were typed and its’ portion sizes, which was estimated using household measurements tools, were presented as photos. All comments and suggestions provided by the professionals have been properly considered.
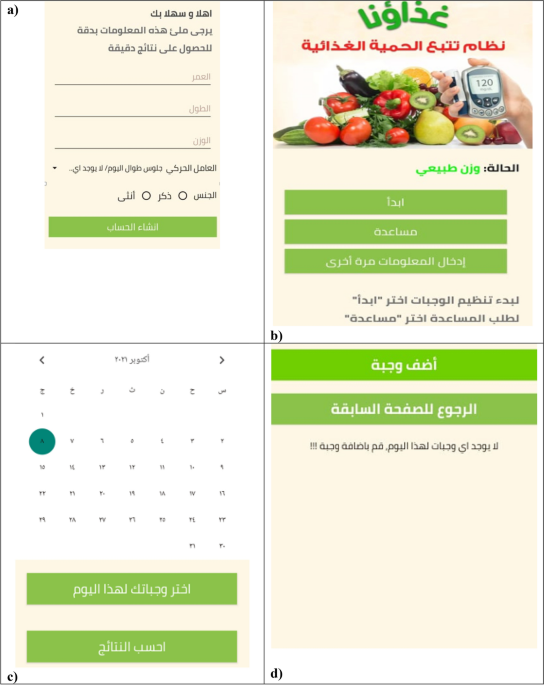
Figure 1a shows the user interface design where each user is required to enter his or her age, sex, weight, height, and physical activity level, which is estimated by the nutritionist based on several questions-related to physical activity. BMI is calculated by dividing weight (kg) by the square of height (m2). Figure 1b shows the main page after the user logging in which consists of three interface categories: start, help, and re-entering the information. Note, the user can request to add a new food, not available in the application database, by clicking on button “help”, thereafter a notification will be sent to the researchers, who are responsible for modifying the food database.


Screenshots taken on Samsung device.
After pressing the start button, another screen, shown in Fig. 1c, appears, consisting of a calendar to choose the date of the day they started to record their dietary intake, and two buttons; (1) select your meals for today, and (2) calculate the dietary intake.
By clicking on button “Select your meals for today”, a screen containing “Add a meal” button and “Return to the previous page” button, will be displayed as illustrated in Fig. 1d. Then, the user selects “Add a meal” to select meals.
Screens displayed in Fig. 1e allow user to choose photos that represent a range of different portion sizes of their consumed foods or drinks, then, user can determine the amounts of their consumed foods or drinks, as there is different options of frequencies (e.g., ½, 1, 1 ½, etc.) After user log all the foods and supplements, they can review the logged foods and beverages. User can also delete or edit some foods/beverages before submission if they desire (Fig. 1f).
Once a user completes logging their food intake, they click on the “Calculate the results” button, is found in the screen displayed in Fig. 1c. Dietary intake data from foods and beverage are automatically forwarded to the server and analyzed to provide dietary feedback. User are provided tailored diet feedback on daily energy and macronutrient intake, as the green color represents total fat intake per day, yellow color represents total protein intaked per day, orange color represents total energy intake per day, and pink color represents total carbohydrate intake per day (Fig. 1g).
Participant recruitment
Participants were recruited from An-Najah National University. A total of 80 participants were invited to join the study and provide their consent. 70 participants were included in the final analysis. The remaining participants were excluded from analysis because they did not complete the 3-DFR (4), wrongly estimated the portion size of meals (i.e. they assessed their portion sizes using household measurements rather than the training-recommended ones) (4), and were outliers of extreme values (2).
Participants’ recruitment and characteristics
Participants were recruited from An-Najah National University. A total of 80 participants were invited to join the study and provide their consent. 70 participants were included in the final analysis. The remaining participants were excluded from analysis because they did not complete the 3-DFR (4), wrongly estimated the portion size of meals (i.e. they assessed their portion sizes using household measurements rather than the training-recommended ones) (4), and were outliers of extreme values (2).
And concerning participants’ characteristics, the student sample was composed of 60 (85.7%) females and 10 (14.3%) males. The mean age of participants was 21.0 ± 2.1 years, ranged from 18 to 25 years old. Only one participant (1.4%) was in the sixth academic year. Most participants (60.0%) were residents either in camps or villages and nearly half of them (45.7%) had a family income ranges between 1500 and 3000 NIS per month. The majority of participants reported not being interested in exercising, while only 12 participants (17.1%) exercised regularly. Our analysis also revealed that nearly half of participants (52.9%) had normal weight, whereas five participants (7.1%) were obese. Moreover, there was no statistical difference between genders in terms of their general characteristics (p > 0.05) as shown in Table 1.
Criterion validity of the Ghithaona application
There were statistically significant correlations between Ghithaona application and the 3-DFR method for energy, carbohydrates, protein, and fat (correlations ranging from 0.261 to 0.582; p ≤ 0.05) as shown in Table 2. The differences between the methods were not significantly different (p > 0.05) for energy, carbohydrates, protein, and fat. The Ghithaona application yielded lower intakes for nutrients protein and fat than the 3-DFR method; with intakes approximately 16% lower for protein, and 4% lower for fat. On the otherhand, the Ghithaona application yielded higher intakes for nutrients energy and carbohydrate than the 3-DFR method, with intakes approximately 7% higher for energy, and 6% higher for carbohydrate.
For energy intake, the mean difference between the Ghithaona application and the 3-DFR method was not significant; the mean energy intake from the 3-DFR was 1560 ± 520 kcal/day while from the application was 1684 ± 622 kcal/day (p > 0.05), with (− 124 kcal/day; 95% Confidence Interval (CI) for bias = − 250 to − 2 kcal/day) (p > 0.05). For random error, the 95% lower and upper Limits of Agreement (LOA) between the two methods for energy intake ranged from − 1163 to 914 kcal/day.
Similarly, the mean difference for carbohydrate, protein and fat intakes were not statistically significant. The mean carbohydrate intake from the 3-DFR was 179 ± 65 g/day, from the application 190 ± 71 g/day (− 10 g/day). The mean protein intake from the 3-DFR was 82 ± 83 g/day, from the application 69 ± 33 g/day (13 g/d). The mean fat intake from the 3-DFR was 75 ± 38 g/day, from the application 72 ± 35 g/day (3 g/day).
The 95% LOA for each of these were narrow (− 151 to 130 g/day for carbohydrates, -146 to 172 g/day for protein, and − 51 to 71 g/day for fat as illustrated in Table 2.
The Bland–Altman plot (Fig. 2) is a scatter plot in which the Y axis shows the difference between the two measurements (from 3-DFR and the Application) and the X axis represents the average of these measures. As recommended, more than 95% of the data points lie within ± 2 standard deviations. The Bland–Altman plots (Fig. 2) for energy, carbohydrate, protein, and fat also illustrate that data for most participants were within the LOA with few outliers, and there was no apparent proportional bias.

Bland–Altman plots showing mean difference (3-DFR—Ghithaona app, solid line) vs. mean intakes ((3-DFR + Ghithaona app)/2) for (a) energy; (b) carbohydrate; (c) protein; (d) fat. The dotted lines indicate the 95% limits of agreement (SD 1.96).
Perceived usability by using Ghithaona application
The analysis of usability survey showed that nearly half of participants strongly agreed that the application is easy to use (48.6%), saves time (47.1%), and helps the participant to pay attention to their dietary habits (52.9%). Furthermore, nearly half of participants agreed that they would like to use this application on continuous basis (50.0%), they felt confident while using the application and believed that most people will learn to use this application very quickly (47.1%). Moreover, half of them agreed that the application can be an alternative for traditional dietary assessment methods (44.3%), decrease participant burden (48.6%), determine the amount of consumed food accurately (52.9%), and help the participant to remember the consumed food items (57.1%). Thirty-one participants (44.3%) also strongly disagreed with the following statement “the application is too cumbersome to use”, however, thirty-three participants (47.1%) disagreed with the following statement “I found that the different functions of this application are well integrated”. Full details regarding perceived usability of the Ghithaona application can be found in Table 3.