Participants
Growth data from 459 children with CP were derived from 1628 patient visits. 21 (4.6%) children with malformations, genetic syndromes, degenerative or progressive lesions were excluded, 49 (10.7%) children were excluded due to missing data. The final sample consisted of 389 children with CP with 1536 measurements. Of these children, 226 (58.1%) were males and 163 (41.9%) were females. The number of measurements performed on each child had a median of 6 with a range from 1 to 14.
Bivariate analysis
There were no significant differences between unilateral and bilateral CP groups in age and sex distribution. Mean height, weight and BMI at the last visit were significantly greater in children with unilateral CP than in those with bilateral CP (p < 0.001). Motor impairment, dysphagia, and prematurity were significantly more prevalent in children with bilateral CP (p < 0.001). Further characteristics of the study population are presented in Table 1.
Height
Figure 1 compares the mean z-scores for height with 95% CI among children with and without unilateral cerebral palsy, GMFCS level, dysphagia and prematurity.
Height-for-age mean z-scores for with 95% CI for height by age in months among children unilateral vs. bilateral cerebral palsy, Gross Motor Function Classification System level I–II vs. III–V, with and without dysphagia and with and without prematurity (n = 1536). If the 95% CI bars overlap, the difference between the two z-score means is not statistically significant (p > 0.05).
Children with unilateral CP had near to normal height gain from 6 to 180 months of life with z-scores of height-for-age close to 0. Children with bilateral CP were significantly shorter than children with unilateral CP (p < 0.001).
Children with GMFCS level III–V were significantly shorter than children with bilateral CP GMFCS level I–II (p < 0.001).
Premature children with CP were not significantly different in height from term children with CP between 6 and 18 months (p = 0.117). From 24 to 108 months of life premature children had significantly less growth than term children with CP. After this age, the height growth is similar in both groups. Particularly interesting is the fact that term children with CP had near to normal height gain from 6 to 132 months. But at this age height z-scores dropped when compared to children with CP born premature.
Children without dysphagia had close to normal height gain from 6 to 180 months of life, whereas children with dysphagia were significantly shorter (p < 0.001).
Weight
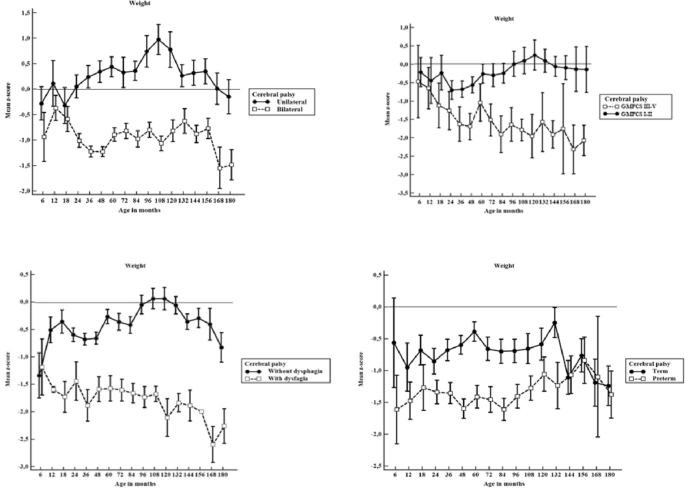
Figure 2 displays estimated mean z-scores for weight with 95% CI among children with and without unilateral cerebral palsy, GMFCS level, dysphagia and prematurity.
Weight-for-age mean z-scores with 95% CI for weight by age in months among children unilateral vs. bilateral cerebral palsy, Gross Motor Function Classification System level I–II vs. level III–V, with and without dysphagia, and with and without prematurity (n = 1536). If the 95% CI bars overlap, the difference between the two z-score means is not statistically significant (p > 0.05).
Children with unilateral CP had near to normal weight gain from 6 to 180 months of life with means of z-scores of weight-for-age of between − 0.5 to + 1. Children with bilateral CP were significantly lighter (p < 0.001).
Considering GMFCS, children with levels I–II had near to normal weight gain with means of z-scores of weight-for-age of between − 0.5 to 0.5, whereas children with levels III–V were significantly lighter (p < 0.001).
Premature children with CP were not significantly different in weight from term children with CP from 6 to 18 months (p > 0.05). From 24 to 108 months of life premature children had significantly less weight than term children with CP. After this age, weight gain is similar in both groups. Parallel to linear growth, term children with CP had near to normal weight gain from 6 to 132 months. But at this age weight z-scores dropped when compared to children with CP born preterm.
Children with dysphagia were significantly lighter than children without this disorder, showing negative z-scores of weight-for-age (p < 0.001).
Body Mass Index
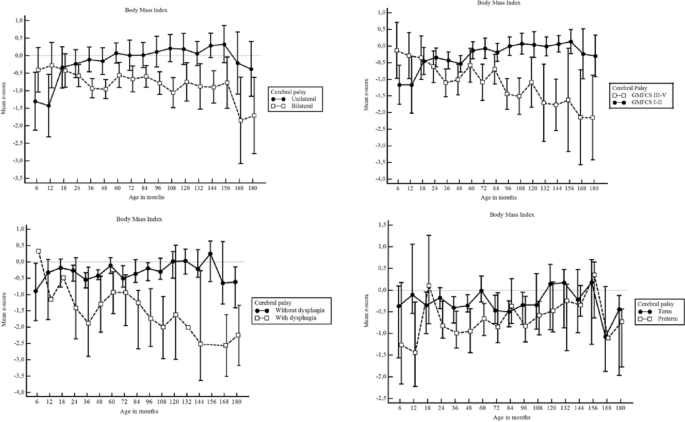
Figure 3 displays estimated mean z-scores for BMI with 95% CI among children with and without unilateral cerebral palsy, GMFCS level, dysphagia and prematurity.
Body Mass Index for age mean z-scores with 95% CI for weight by age in months among children unilateral vs. bilateral cerebral palsy, Gross Motor Function Classification System level I–II vs. level III–V, with and without dysphagia, and with and without prematurity (n = 1536). If the 95% CI bars overlap, the difference between the two z-score means is not statistically significant (p > 0.05).
Children with unilateral CP had near to normal BMI gain from 6 to 180 months of life, with means of z-scores of BMI-for-age of between − 0.5 and 0.5. Children with bilateral CP were significantly lower (p < 0.001). Considering GMFCS, children with levels I–II had near to normal BMI gain with means of z-scores of BMI-for-age of between − 0.5 to 0.5, whereas children with levels III–V had a significantly lower BMI (p < 0.001).
Premature children with CP were not significantly different in BMI from term children with CP from 6 to 180 months (p > 0.05). Children with dysphagia had significantly lower mean BMI z-scores than children without this disorder, (p < 0.001).
Multivariate analysis
Height
In the main effect model, children with bilateral CP, GMFCS level III–V and dysphagia were significantly shorter than children with unilateral CP. Prematurity was not significantly associated with poor height growth in children with bilateral CP compared with children with unilateral CP.
In the interaction effect model, children with bilateral CP and GMFCS level III–V were − 0.943 [− 1.129; − 0.756] z-score units shorter than children with unilateral CP (p < 0.001), plus − 1.360 [− 2.183 to − 0.537] of the bilateral condition alone, resulting in an overall average decrease of − 2.303 in the height z-score. Children with bilateral CP and dysphagia had − 0.545 [− 0.785; − 0.305] z-score units lower z-score of height-for-age than children with unilateral CP (p < 0.001), and remain significantly shorter compared to their peers (Table 2a).
Weight
In the main effect model, children with bilateral CP, GMFCS level III–V and dysphagia were significantly lighter than children with unilateral CP. Prematurity was not significantly associated with poor weight gain in children with bilateral CP compared with children with unilateral CP.
In the interaction effect model, children with bilateral CP and GMFCS level III–V remain significantly lighter than children with unilateral CP, decreasing their weight-for-age z-score − 1.449 [− 10.526; − 0.677] units compared to children with Unilateral CP (p < 0.001). Children with bilateral CP and with dysphagia were lighter, growing − 0.629 [− 1.189; − 0.068] z-score units below their weight-for-age compared to children with unilateral CP (p < 0.001) (Table 2b).
Body Mass Index
In the main effect model, children with bilateral CP, GMFCS level III–V and dysphagia had a significantly lower BMI than children with unilateral CP. Prematurity was not significantly associated with poor BMI gain in children with bilateral CP compared to children with unilateral CP.
In the interaction effect model, children with bilateral CP, GMFCS level III–V and dysphagia remained with a significantly lower BMI than children with unilateral CP (Table 2c). Children with bilateral CP and GMFCS level III–V decreased their BMI-for-age z-score − 0.375 [− 0.724; − 0.026] units compared to children with Unilateral CP (p = 0.036). Children with bilateral CP and with dysphagia were lighter, growing − 0.854 [− 1.295; − 0.414] z-score units below their BMI-for-age compared to children with unilateral CP (p < 0.001).


