Target population
Recruitment was conducted by placing posters within the university campus and posting an application form on the Toho University School of Medicine website. The participants of the study were healthy adults aged between 20 and 64 years, who reported no taste abnormalities. All participants who enrolled in the study were given a written explanation about the content of the experiment, and informed consent was obtained prior to the commencement of the study. After an assessment of their oral condition, the participants were randomly assigned to two groups: a training group that received taste recall training to improve taste perception and a control group that did not receive training. Both groups were evaluated for taste sensitivity and the training group underwent taste recall training using filter paper discs impregnated with reagents for qualitative and quantitative taste analyses. Taste sensitivity evaluation and taste recall training were conducted in a speech and hearing training room, closed to any external sounds and smells to focus entirely on taste while controlling for any extraneous variables.
The study was conducted in accordance with the Declaration of Helsinki and other important ethical principles. This study has been approved by the Ethics Committee of Toho University School of Medicine (authorization no. A21024_A19032). This study was registered with the Japan Registry of Clinical Trials (jRCT1032210332) on 22/09/2021 and the data were made publicly available.
Randomization
Participants were assigned to the training group and the control group using simple randomization. Participants were identified by their initials and date of birth and assigned a participant number. They were assigned a unique participant number by the investigator as per the order of a computer-generated randomized list.
Oral status assessment
The participants’ oral status was assessed using the Oral Health Assessment Tool Japanese version (OHAT-J)29, and dental status was assessed using the Eichner classification30. Oral dryness was evaluated using an oral moisture checking device (Oral Moisture Checker Mucus®, Life Co., Ltd., Saitama)31. The measurement principle of this device is based on the impedance value generated through the tip of a capacitive sensor using the resonance frequency of the alternating current. The relative values reflecting the moisture content, were measured by applying the sensor to the tongue and the measurement value was determined to be the mean value of three consecutive measurements. A normal level of moisture content was 29.6 or higher, whereas a measurement value ranging from 28.0 to 29.5 was defined as borderline dry, and a value of 27.9 or lower indicated dryness of the oral cavity. Measurements were taken by pressing the oral moisture checker against the center of the lingual mucosa, approximately 10 mm from the tip of the tongue. Tongue pressure was measured using a tongue pressure measuring device (JMS Tongue Pressure Gauge®, JMS Co., Ltd., Hiroshima) to assess the participants’ oral motor skills32. After automatically adjusting the initial pressure of the probe’s balloon, participants were instructed to place the oral probe inside their mouth and bite the hard ring connected to it, to make sure that the probe did not shift. Then, they were asked to push the probe’s balloon against the hard palate with the tip of the tongue with maximum force and the tongue pressure was recorded. We considered a pressure of < 20 kPa as indicative of the risk of aspiration.
Taste sensitivity assessment
Taste sensitivity was evaluated using 5 mm filter paper discs impregnated with reagents for qualitative and quantitative taste analyses (Taste Disc®, Sanwa Kagaku Kenkyusho Co., Ltd., Nagoya). The reagents consisted of test solutions for primary taste qualities (sweetness, saltiness, sourness, and bitterness), each having five different concentration levels (1–5), with 1 being the lowest and 5 being the highest. The substances used to represent sweetness, saltiness, sourness, and bitterness were sucrose, NaCl, tartaric acid, and quinine HCl, respectively. The concentration levels used for each substance were: 0.3%, 2.5%, 10%, 20%, and 80% for sucrose; 0.3%, 1.25%, 5%, 10%, and 20% for NaCl; 0.02%, 0.2%, 2%, 4%, and 8% for tartaric acid; and 0.001%, 0.02%, 0.1%, 0.5%, and 4% for quinine HCl. The filter paper discs were soaked in one of the four different taste solutions, randomly selected and applied, with pincers, on the participants’ tongues at increasing concentration grades starting from the lowest (1). The discs were placed 2 cm to the left of the tip of the tongue in the area innervated by the chorda tympani nerve for 2 s. The participants were asked to guess each taste they were exposed to, and the lowest concentration at which a specific taste was identified was noted as their taste recognition threshold. Before evaluating a new taste solution, participants were asked to thoroughly rinse their mouths to neutralize any lingering taste from the previous solution.
Taste recall training
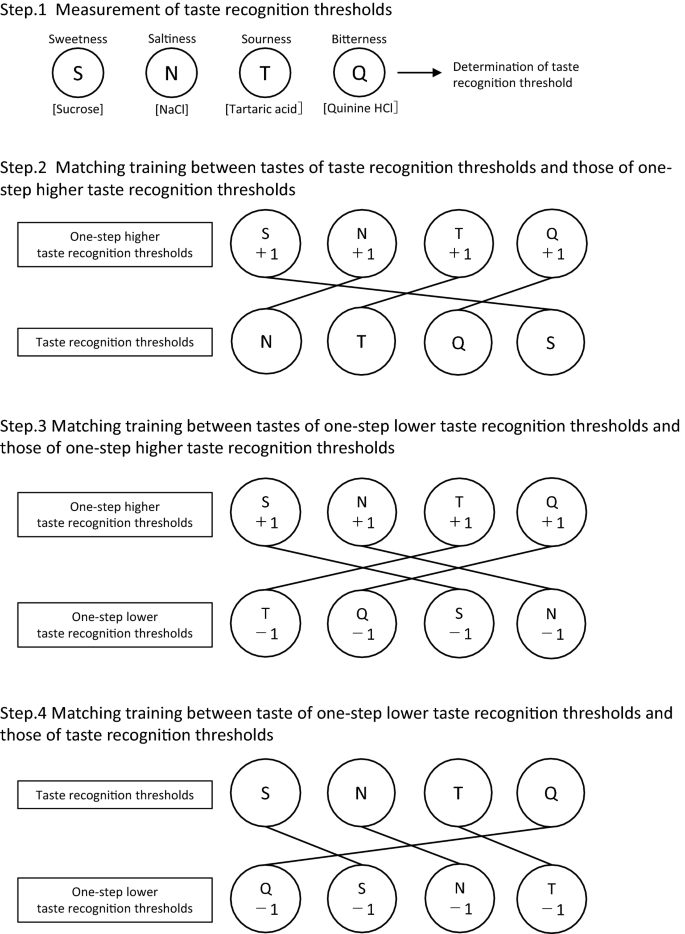
The training group underwent taste recall training for three days. The taste recall training process is composed of the following four steps (Fig. 3).
Overview of the taste recall training program. Filter paper discs impregnated with reagents for taste qualitative and quantitative analysis were used in all steps. S: sweetness, N: saltiness, T: sourness, Q: bitterness. + 1 indicates a one-step higher concentration than the initially measured taste recognition threshold and − 1 indicates a one-step lower concentration than the initially measured taste recognition threshold.
Step 1 Participants’ taste recognition threshold for each of the four tastes was measured using the filter paper disc method.
Step 2 Using the filter paper disc method, the participants were repeatedly exposed to each of the four tastes randomly. After having been told which taste was which, they were exposed to a one-step higher concentration than their taste recognition threshold in each of the four tastes until they could accurately identify them. Next, the participants were again repeatedly exposed to all the tastes in a random order, in the concentrations that matched their taste recognition threshold. Subsequently, they were asked to compare these tastes with each of the four tastes at the one-step higher concentration until their perception of each taste at the selected concentrations was perfectly matched.
Step 3 As in step 2, the participants were repeatedly exposed to each of the four tastes using the filter paper discs, in a random order, after having been told which taste was which, at a one-step higher concentration than their taste recognition threshold until they could accurately identify them. Next, they were repeatedly exposed to all the tastes at a one-step lower concentration than their taste recognition threshold until they could accurately identify them. Further, they were asked to compare these tastes with each taste at a one-step higher concentration until their perception of each taste at the selected concentrations was perfectly matched.
Step 4 As in step 2 and 3, using the filter paper disc method, the participants were repeatedly exposed to each taste, in random order, after having been told which taste was which, until they could accurately identify all of the four tastes at the taste recognition threshold. Next, they were repeatedly exposed to each of the tastes at a one-step lower concentration than their taste recognition threshold until they could accurately identify them. Further, they were asked to compare these tastes with each of the tastes at the taste recognition threshold until their perception of each taste at the selected concentrations was perfectly matched. This was done so that they could eventually identify each taste at a one-step lower concentration than their taste recognition threshold.
As in the evaluation of taste sensitivity, the filter paper discs used for taste recall training were placed 2 cm to the left of the tip of the tongue in the area innervated by the chorda tympani nerve. We compared the initial and final taste recognition thresholds between the training and control groups to examine changes in taste sensitivity. In the training group, daily changes in the taste sensitivity for each taste were examined.
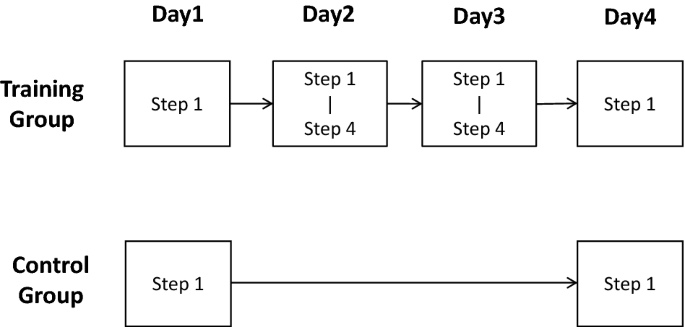
The training group underwent taste recall training for 3 days, using filter paper discs impregnated with reagents for qualitative and quantitative taste analyses. On the fourth day, their taste sensitivity was evaluated again. Meanwhile, following the first evaluation, the participants in the control group went about their daily life as usual, and on the fourth day, their taste sensitivity was evaluated again (Fig. 4).
There were no changes to the trial outcomes or methods during the trials. Interim analyses were not conducted.
Statistical analyses
The sample size was calculated based on the previous Taste Disc® study33 with a significance level of 5%, a power of 80%, an effect size of 0.5, and a minimum requirement of 17 participants in each group.
Statistical analyses were conducted using software R version 3.6.3. We employed a paired t-test to analyze the changes between the initial and final taste recognition thresholds and a Friedman test to analyze daily changes in taste sensitivity of the training group. The significance level was set to 5% (two-tailed).


