Study design
This study used data collected from the Generation R Study, a prospective birth-cohort study in the city of Rotterdam, in The Netherlands [18]. We included objectively determined measures of BMI at the age of 4, 6, 10 and 14 years, and DXA-derived measures of fat mass at the age of 6 and 10 years. At each time-point, home addresses were linked with food environment data of the preceding year. The latter were only available from 2004 onwards, therefore we did not include outcomes collected in preceding years.
Study population
Invitations to participate in the Generation R Study were sent out to all pregnant women who had an expected delivery date between April 2002 and January 2006 and who lived in the study area (Rotterdam, The Netherlands) at time of delivery [18]. The Medical Ethics Committee of the Erasmus University Medical Centre in Rotterdam approved the study (MEC 217.595/2002/20). Written informed consent was obtained from parents at child ages of 4, 6 and 10 years, and from parents and children at the age of 14 years.
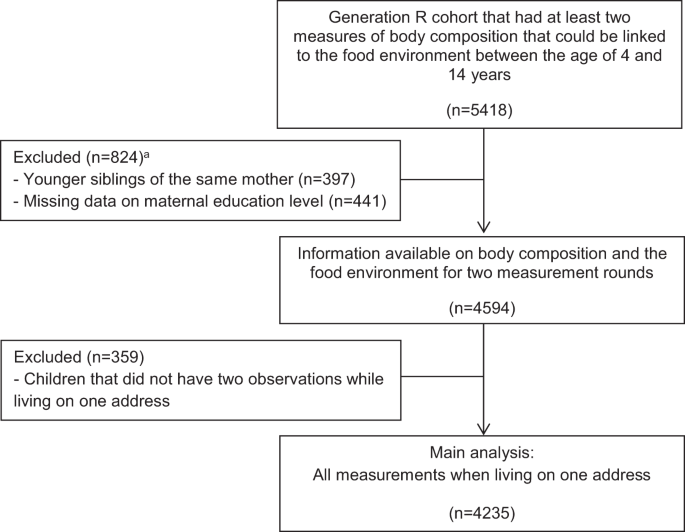
In total, 9901 children and their parents participated in the Generation R Study at baseline. Children with at least two outcome measures that could be linked to the food environment between the ages of 4 and 14 years (n = 5418) were included. Younger siblings from the same mother (n = 397), and children from which information on maternal education level were missing (n = 441) were excluded. In total, 4594 children were eligible for the present study. We included observations for the address where the child lived for the longest period between the age of 4 and 14 years, and children without two consecutive observations on one address (n = 359) were excluded. The sample for the main analysis included 4235 children with 11,277 person-observations for BMI, and 6240 person-observations for fat mass (Fig. 1).

aMore than one reason could apply.
Food environment
Data on location (X and Y coordinates) and type of food outlet were obtained from Locatus, a commercial company that collects information on food retailers in The Netherlands by means of yearly field audits. A validation study using field audit data found an overall ‘good’ to ‘excellent’ agreement for both the location and classification [19]. X and Y coordinates of children’s home addresses, and X and Y coordinates of food retailers in the year preceding the outcome measure, were mapped using a geographic information system (GIS) (GIS-ArcGIS 10, ESRI, Redlands, CA, USA). Euclidean buffers of 400 m were used to count the number of food retailers located around the home, for each time-point in the study. The 400 m distance represents a walking distance of ~5 min. Dutch cities are characterised by high connectivity that is supportive of active forms of transportation. Therefore, a distance of 400 m seems an appropriate distance to assess the food environment in this context.
We considered all fast-food outlets, grillrooms/kebab shops, take away outlets, and ice cream shops that were classified by Locatus and available in the database as ‘fast-food outlets’. The ‘absolute fast-food exposure’ reflects the total number of fast-food outlets within the 400 m buffer around home. Because the dominance of fast-food outlets over other types of food outlets may drive purchasing behaviour and diet quality [13, 20], we also calculated the ‘relative fast-food exposure’ by dividing the total number of fast-food outlets by the total number of food outlets.
The food environment consists of a variety of outlets that may all influence food choices and ultimately obesity. To capture the healthiness of the food environment, we also calculated a healthiness score of all food outlets previously developed in a Delphi study [21]. Scores ranged from −5 points (very unhealthy) to +5 points (very healthy). Fast-food was considered the most unhealthy food outlet (−4.9 points), whereas the green-grocer was considered the most healthy food outlet (4.8 points). We calculated the average healthiness score of the food environment within 400 m from home. Addresses without any food outlet were excluded, since it is uncertain what value to assign to these addresses.
Body composition measures
At the age 4 years, body height and weight measurements were performed during routine visits at the Child Health Centres. At the age of 6, 10 and 14 years, children visited the research centre in the Erasmus Medical Centre for detailed physical examinations. During all examinations, height and weight were measured without shoes and heavy clothing. Height was measured to the nearest millimetre by a stadiometer (Holtain Limited, Dyfeld, UK). Weight was measured to the nearest gram using an electronic scale (SECA, Almere, The Netherlands). BMI was calculated [weight (kg)/height (m2)] and age- and sex-specific standard deviation scores (SDS) for BMI were obtained from Dutch reference growth charts (Growth Analyzer 4.0, Dutch Growth Research Foundation) [22].
Body composition was measured at the research centre at the age of 6 and 10 years using a DXA scanner (iDXA, GE-Lunar, 2008, Madison, WI, USA) using enCORE software version 12.6. Children were placed without shoes, heavy clothing and metal objects in supine position on the DXA table. We calculated fat mass index (FMI) [fat mass (kg)/height (m3)] and fat-free mass index (FFMI) [fat-free mass (kg)/height (m3)] according to standard procedures [23]. We calculated SDS for FMI and FFMI [(observed value − mean)/SD] on the basis of the cross-sectional sample distribution within the Generation R Study population to enable comparisons of effect estimates for FMI and FFMI.
Maternal education level
We used maternal education level to stratify the analyses by SEP. The highest education level attained was established by questionnaire at the child’s age of 6 years, and categorized according to the Dutch Standard Classification of Education into high (university degree), mid-high (higher vocational training, bachelor’s degree), mid-low (>3 years general secondary school, intermediate vocational training) and low (no education, primary school, lower vocational training, intermediate general school or ≤3 years general secondary school)) [24].
Other sociodemographic variables
Sociodemographic characteristics obtained at baseline and during follow-up visits by means of questionnaires included age, sex, ethnicity and net household income. In accordance with Statistics Netherlands [25], a child’s ethnic background was classified as native Dutch, other-Western background, and non-Western background based on the country of birth of the child’s parents. Net household income was asked for at the child’s age of 6, 10 and 14 years, and categorized into low (≤€2000/month), intermediate (<€2000–€3200/month and <€2000–€3300/month at the age of 14 years) and high (>€3200/month and >€3300/month at the age of 14 years).
Statistical analyses
Characteristics of the children during the first and last measurement when living on the same address were presented. Number of missing values were presented in the supplement (Appendix 1). The median follow-up period was 7.1 years. Yet, large differences were seen across levels of maternal education, with children from lower educated mothers having the shortest follow-up time. Therefore, changes in the food environment over time were standardised, and expressed as the changes over 7.1 years. Kernel density plots with normal distribution approximation [26] were used to visualise the within-person changes in the food environment over time. Histograms suggested that the change over time approximated a normal distribution (Appendix 2). Linear regression models were used to test the change in the food environment over 7.1 years by four levels of maternal education. Associations were expressed as the change in relative contribution of fast-food outlets, absolute number of fast-food outlets, and the healthiness of the food environment over 7.1 years.
Fixed-effects linear regression models with repeated measurements were used to study within-person changes in the food environment and the association with within-person changes in body composition measures. We tested for interactions with maternal education level to assess whether the association between changes in the food environment and changes in body composition differed by level of maternal education. To retain statistical power, maternal education was categorised into lower (low, mid-low) and higher (mid-high, high) education. We used up to four measures of BMI, and two measures of FMI and FFMI. This method allowed to control for measured time-variant variables and for unmeasured time-invariant variables [27]. All models were specified using the first-difference model, and evaluated the change between two waves available, which were not necessarily two consecutive waves. Models were adjusted for the time between measurements. The specification of the model is presented in the supplement (Appendix 3).
Results were presented as a relative increase by 10%-point in fast-food outlets, an absolute increase by one fast-food outlet, and per 0.5 point increase in healthiness score of the food environment (which indicates a healthier environment). Units were based on the average change for those with changes in the population between time-points (Supplementary Table 1).
The aforementioned analyses assume a linear exposure–response relationship, whereby every unit decrease or increase in the food environment has a similar effect. However, changes observed for children without any fast-food outlet available (e.g. from 0 to 2 outlets) may have stronger effects than similar changes observed at the higher end of the distribution (e.g. from 5 to 7 outlets). Hence, we also performed analyses restricted to children without any fast-food outlets during the first measurement round, and explored if the introduction of fast-food outlets mattered for the subsequent changes in outcomes.
Two sensitivity analyses were conducted. First, we controlled for the time-varying factor net household income, since having a higher income may contribute to healthier dietary behaviours [28]. Income was not collected at age 4 years, thus this analysis was restricted for the age of 6, 10 and 14 years. We excluded children for which net household income was missing at all time-points (n = 222). Income did not change between time-points for 77.5% of the children. We imputed income measured at the nearest time-point assuming that income did not change (12.7% imputations). Second, we additionally included changes resulting from residential moves. In this analyses, we included 4594 children with 13,528 person-observations of BMI, and 7856 person-observations on fat mass.
All analyses were conducted in R version 3.4.1, using the plm package for the fixed-effects analyses. Clustered sandwich estimators were used to allow for within-child correlation between error terms. Two-sided P values <0.05 were considered statistically significant. R scripts are available for researchers upon authors request.