LcS and experimental animals
LcS is present in Yakult 300 light yogurt beverage, which was purchased from Yakult Taiwan (Taipei, Taiwan). The LcS samples were created by freeze-drying 125 mL of Yakult 300 light beverage containing 1.25 × 10¹⁰ CFU to 11.88 g. The freeze-dried samples were adjusted to 2.44 g (2.5 × 10⁹ CFU) in 1 mL distilled water, and the CFU of LcS was confirmed just before beginning of this study. Eight-week-old BALB/c mice were purchased from LASCO (Ilan, Taiwan) and housed in standard laboratory conditions (12/12-h light/dark cycle, 22–24 °C, 40–60% humidity). The mice were fed a commercially available diet (local supplier), and sterile water was provided ad libitum. Sixty female mice were divided into six groups (namely the NCi, Li, Hi, NCn, Ln, and Hn groups). The mice in each group (n = 10) were equally divided into two cages (5 mice/cage) to provide appropriate space for the mice. The groups for the first antigen presentation model (the NCi, Li, and Hi groups) received OVA by injection to simulate injective vaccination. The other antigen presentation model included the NCn, Ln, and Hn groups, which were given OVA by injection plus intranasal administration to imitate the mouse model of allergic asthma. OVA (≥ 98%, Grade V, A5503, Sigma-Aldrich, Saint Louis, MO, USA) was administered via subcutaneous (s.c.) injection at 20, 60, and 60 µg/mouse in the second, fourth, and sixth weeks, respectively. Moreover, each mouse in the NCn, Ln, and Hn groups was additionally treated with 50 µL of 5% OVA per day via intranasal administration for 3 days in the fourth week and 4 days before sacrifice. The OVA treatment protocol was based on our pilot study that successfully induced asthma, as AHR and BALF were significantly higher in the OVA-treated mice than the non-treated mice in the pilot study (Supplementary Table 2). Mice in the NCi and NCn groups were fed 200 µL of distilled water, and mice in the Li and Ln groups were fed a low dose of LcSFB (2.5 × 10⁹ CFU/kg body weight [BW]) of LcSFB sample suspended in 200 µL of distilled water. Moreover, the mice in the Hi and Hn groups were given a high dose of LcSFB (5 × 10⁹ CFU/kg BW of the LcSFB sample dissolved in 200 µL of distilled water). The doses of LcSFB were decided according to the recommend dose of LcS, which is 1.25 × 10¹⁰ CFU/day/person according to a report by the US Food and Drug Administration26. Assuming the average human weight of 60 kg, the dose for a mouse is 1.25 × 10¹⁰ CFU/person/day × 12.3 (conversion constant between mice and humans) ÷ 60 kg/person = 2.5 × 10⁹ CFU/kg/day. As 2.5 × 10⁹ CFU/kg/day of LcS was a relatively low dose in previous studies exploring the immunoregulatory effects of LcS14,27,28, 2.5 × 10⁹ CFU/kg/day and double this dose were selected for this study. The LcSFB sample was given to the mice via gavage for 8 weeks. Blood was collected in the 8th week, and the sacrifice was performed by CO2 inhalation at the end of the eighth week. The experimental procedure is shown in Fig. 8. Briefly, BALB/c mice received either distilled water or Lactobacillus casei Shirota fermented beverage (LcSFB) every day. Ovalbumin (OVA) was given to all groups by subcutaneous (s.c.) injection on the 14th, 28th, and 42nd days. Moreover, the NCn, Ln, and Hn groups were treated with OVA via the intranasal route on the 28th, 29th, 30th, 52nd, 53rd, and 54th days. Airway hyperresponsiveness (AHR) was assessed in the NCn, Ln, and Hn groups on the 55th day. The mice were sacrificed on the 56th day, and the proliferation of splenocytes, percentages of regulatory T (Treg) and T helper (Th) lymphocytes in splenocytes, OVA‐specific antibodies, and cytokines were measured.

Schematic illustration of the experimental protocol. Briefly, BALB/c mice received either distilled water or Lactobacillus casei Shirota fermented beverage (LcSFB) every day. Ovalbumin (OVA) was given to all groups by subcutaneous (s.c.) injection on the 14th, 28th, and 42nd days. Moreover, the NCn, Ln, and Hn groups were treated with OVA via the intranasal route on the 28th, 29th, 30th, 52nd, 53rd, and 54th days. Airway hyperresponsiveness (AHR) was assessed in the NCn, Ln, and Hn groups on the 55th day. The mice were sacrificed on the 56th day, and the proliferation of splenocytes, percentages of regulatory T (Treg) and T helper (Th) lymphocytes in splenocytes, OVA‐specific antibodies, and cytokines were measured.
MTT assay
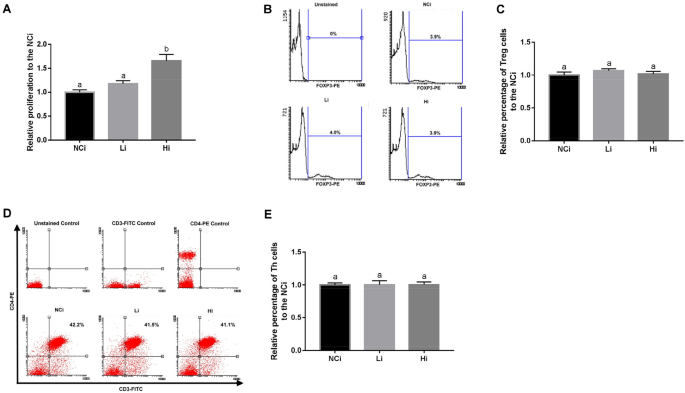
Splenocytes were isolated from the mice, seeded at 2 × 10⁶ cells/well into 24-well plates, and incubated with 20 μg/mL/well OVA. After 72 h, 100 μL of 5 mg/mL 3-(4,5-dimethylthiazol-2-yl)-2,5-diphenyltetrazolium bromide (MTT, Sigma-Aldrich) was added into each well and incubated at 37 °C for 3.5 h. The cells were added to 400 μL of MTT solvent (4 mM HCl mixed with isopropanol) and shaken at room temperature for 15 min. Absorbance was read at 590 nm with a reference filter of 620 nm using an ELISA reader (PerkinElmer, Waltham, MA, USA).
Measuring OVA-specific antibodies in serum
The serum levels of OVA-specific antibodies were determined using ELISA kits purchased from Chondrex (Redmond, WA, USA), including an Mouse Anti-OVA IgE Antibody Assay Kit, Mouse Anti-OVA IgA Antibody Assay Kit, Mouse Anti-OVA IgM Antibody Assay Kit, and Mouse Anti-OVA IgG Antibody Assay Kit. Briefly, the 96-well plates were coated with OVA at 4 °C overnight. Then, the plates were washed with PBST solution (phosphate-buffered saline with 0.1% Tween® 20) and blocked with Blocking Buffer for 1 h at 37 °C. After washing, 100 μL aliquots of sera at appropriate dilution ratios were added, and the plates were incubated at 37 °C for 1 h. Next, the plate was washed with PBST and Detection Antibody was added. The plates were incubated at 37 °C for 1 h and then washed. Subsequently, TMB solution was added and incubated for 25 min at room temperature followed by three washes. The reactions were terminated using Stop Solution, and absorbance was read at 450 nm using an ELISA reader (BioTek, Winooski, VT, USA). All samples were run in triplicate.
Measurement of cytokines
Splenocytes were collected in the eighth week and 2 × 10⁶ cells/well were cultured in the presence of OVA (20 μg/mL/well) for 72 h. IL2, interferon-γ (IFN-γ), IL-4, and IL-5 levels were assayed using ELISA kits (BioLegend) following the manufacturer’s protocol. All samples were assessed in triplicate.
Immune cell detection
Immune cells were detected using antibodies against CD3-FITC/CD4-PE (17A2/RM4-5, BioLegend) (Th cells), and CD3-FITC/CD4-PE/FOXP3-PE-Cy5 (FJK-16s, eBioscience) (Treg cells). To identify Th cells, splenocytes were incubated with different combinations of antibodies for 20 min, and the supernatant was removed via centrifugation at 400g for 5 min. After being washed twice with PBST, the cells were re-suspended in 0.5 mL of PBS. Treg cells were stained using the eBioscience™ Foxp3/Transcription Factor Staining Buffer Set (eBioscience), according to the instruction manual. Briefly, cells were stained with CD3-FITC/CD4-PE following the same procedure for staining Th cells. Then, the cells were fixed and permeabilized using IC Fixation Buffer and Permeabilization Buffer, respectively. After being washed twice, the cells were incubated with FOXP3-PE-Cy5 antibody for 30 min. The cells were subsequently washed twice, resuspended, and stained cells were detected utilizing a BD FACSCanto II flow cytometer (BD, Franklin Lakes, NJ, USA). Single stained controls were used to establish fluorescent compensation parameters. Unstained cells were used as negative controls.
Airway hyperresponsiveness
AHR was assessed in unrestrained mice using whole-body barometric plethysmography (Model PLY 3211; Buxco Electronic Inc., Sharon, CT, USA) that recorded enhanced pause (Penh). Pulmonary resistance was calculated by changing the chamber pressure via administration of methacholine during inspiration and expiration. After a brief rest in the chamber, the mice received an initial baseline administration of saline followed by increasing doses of nebulized methacholine. During the exposure period, each mouse was sequentially given 0, 3.125, 6.250, 12.500, and 25.000 mg/mL of methacholine. Mice remained in the chamber for 3 min, and their respiratory rate was counted. Finally, the Penh values were averaged and reported as percentages of the baseline saline values.
Bronchoalveolar lavage fluid isolation
BALF was isolated by lavage with 1 mL of PBS. The cells in the BALF were centrifuged (4000g, 5 min), transferred onto slides, fixed, and stained using Liu’s stain kit (Shin-Yung medical instruments, Taipei, Taiwan). Standard morphological criteria were used to classify the individual leukocytes.
Statistics
The data were analyzed using one-way ANOVA with Tukey HSD post-hoc tests using SPSS 22.0 (IBM, Armonk, NY, USA). The data are presented as mean ± standard error of the mean (SEM). A p value < 0.05 was considered to be statistically significant; values marked with different superscript letters are significantly different.
Ethical approval
All of animal experiments were performed by well-trained investigators and in accordance with protocols approved by the Institutional Animal Care and Use Committee (IACUC) of Shih Chien University (IACUC-10509). The authors complied to the ARRIVE guidelines for reporting animal research29.